EX-99.1
Published on September 13, 2023
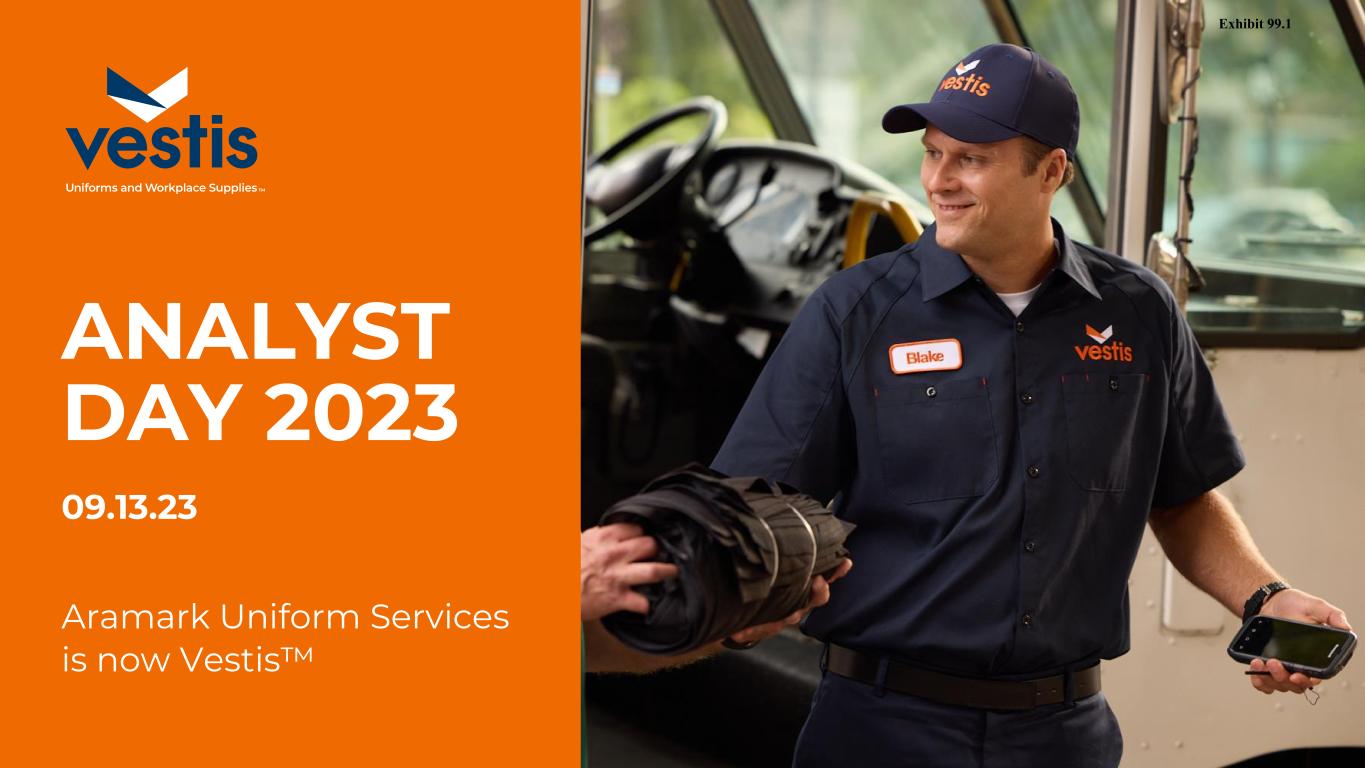
ANALYST DAY 2023 Aramark Uniform Services is now Vestis™ TM 09.13.23
2TM Special Note About Forward-Looking Statements This presentation and other materials Aramark and Vestis have filed or will file with the Securities and Exchange Commission (and oral communications that Aramark or Vestis may make) contain or incorporate by reference “forward-looking statements” within the meaning of the securities laws. All statements that reflect Aramark’s or Vestis’ expectations, assumptions or projections about the future, other than statements of historical fact, are forward-looking statements, including, without limitation, statements under the heading "We have a Robust Strategic Plan to Deliver Shareholder Value," "Positioned to Deliver Long-Term Revenue Growth and Margin Expansion Targets," and “Capital Allocation Priorities," forecasts relating to discussions of future operations and financial performance (including volume growth, pricing, sales and adjusted operating income and EBITDA growth and cash flows) and statements regarding Aramark’s or Vestis’ strategy for growth, future product development, regulatory approvals, competitive position and expenditures. These statements include, but are not limited to, statements related to Aramark’s or Vestis’ expectations regarding the impact of the ongoing COVID-19 pandemic, the performance of Aramark’s or Vestis’ business, Aramark’s or Vestis’ financial results, Aramark’s or Vestis’ operations, Aramark’s or Vestis’ liquidity and capital resources, the conditions in Aramark’s or Vestis’ industry and Aramark’s or Vestis’ growth strategy. In some cases, forward-looking statements can be identified by words such as "path," pathway," "strategy, “ "opportunity," "potential," "target," "estimate,” “expect,” "will," "pursue," “will be,” “will continue,” “project,” “plan,” “believe,” and other words and terms of similar meaning or the negative versions of such words. These forward-looking statements are subject to risks and uncertainties that may change at any time, and actual results or outcomes may differ materially from those that Aramark or Vestis expected. Forward-looking statements are not guarantees of future performance and are subject to risks, uncertainties, and changes in circumstances that are difficult to predict. Although each of Aramark and Vestis believes that the expectations reflected in any forward-looking statements it makes are based on reasonable assumptions, it can give no assurance that these expectations will be attained and it is possible that actual results may differ materially from those indicated by these forward-looking statements due to a variety of risks and uncertainties. Such risks and uncertainties include, but are not limited to: unfavorable economic conditions; increases in fuel and energy costs; the failure to retain current customers, renew existing customer contracts and obtain new customer contracts; natural disasters, global calamities, climate change, new pandemics, sports strikes and other adverse incidents; competition in Vestis’ industry; increased operating costs and obstacles to cost recovery due to the pricing and cancellation terms of Vestis’ support services contracts; a determination by Vestis’ customers to reduce their outsourcing or use of preferred vendors; risks associated with suppliers from whom Vestis’ products are sourced; challenge of contracts by Vestis’ customers; Vestis’ expansion strategy and its ability to successfully integrate the businesses it acquires and costs and timing related thereto; currency risks and other risks associated with international operations, including compliance with a broad range of laws and regulations, including the United States Foreign Corrupt Practices Act; the COVID-19 pandemic’s impact on the United States and global economies, including particularly the customer sectors Vestis serves and governmental responses to the pandemic; Vestis’ inability to hire and retain key or sufficient qualified personnel or increases in labor costs; continued or further unionization of Vestis’ workforce; liability resulting from Vestis’ participation in multiemployer-defined benefit pension plans; liability associated with noncompliance with applicable law or other governmental regulations; laws and governmental regulations including those relating to the environment, wage and hour and government contracting; increases or changes in income tax rates or tax-related laws; new interpretations of or changes in the enforcement of the government regulatory framework; a cybersecurity incident or other disruptions in the availability of Vestis’ computer systems or privacy breaches; the expected benefits and timing of the separation, and the risk that conditions to the separation will not be satisfied and/or that the separation will not be completed within the expected time frame, on the expected terms or at all; the risk of increased costs from lost synergies, costs of restructuring transactions and other costs incurred in connection with the separation; retention of existing management team members as a result of the separation; reaction of customers, employees and other parties to the separation, and the impact of the separation on each of Vestis’ and Aramark’s businesses; Vestis’ leverage; risks associated with expected financing transactions undertaken in connection with the separation and risks associated with indebtedness incurred in connection with the separation; any failure by Aramark to perform of its obligations under the various separation agreements to be entered into in connection with the separation and distribution; a determination by the IRS that the distribution or certain related transactions are taxable; the possibility that any consents or approvals required in connection with the separation will not be received or obtained within the expected time frame, on the expected terms or at all; and the impact of the separation on its businesses and the risk that the separation may be more difficult, time consuming or costly than expected, including the impact on its resources, systems, procedures and controls, diversion of management’s attention and the impact on relationships with customers, suppliers, employees and other business counterparties. There can be no assurance that the separation, distribution or any other transaction described above will in fact be consummated in the manner described or at all. The above list of factors is not exhaustive or necessarily in order of importance. For additional information on identifying factors that may cause actual results to vary materially from those stated in forward-looking statements, see the discussions under “Risk Factors” and “Management’s Discussion and Analysis of Financial Condition and Results of Operations” in the Information Statement included as Exhibit 99.1 to Vestis’ Current Report on Form 8-K filed with the Securities and Exchange Commission on September 11, 2023 as such matters may be updated from time to time in Vestis’ other periodic filings with the Securities and Exchange Commission. Any forward-looking statement speaks only as of the date on which it is made, and each of Aramark and Vestis assumes no obligation to update or revise such statement, whether as a result of new information, future events or otherwise, except as required by applicable law.
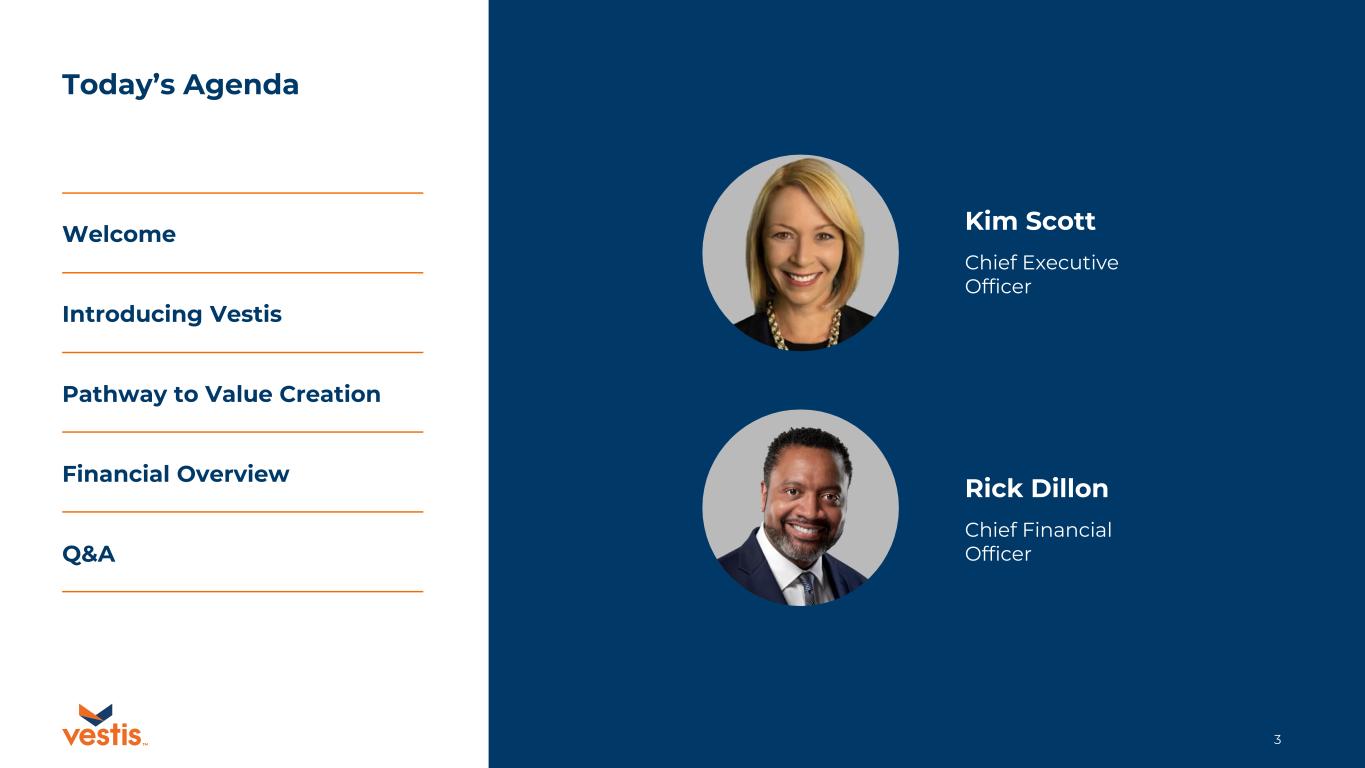
3TM Today’s Agenda Welcome Introducing Vestis Pathway to Value Creation Financial Overview Q&A Kim Scott Chief Executive Officer Rick Dillon Chief Financial Officer
4TM Kim Scott Chief Executive Officer Introducing Vestis Pathway to Value Creation
5TM INTRODUCING VESTIS

6TM Deliver uniforms and supplies that empower people to do good work and good things for others while at work. Our Purpose
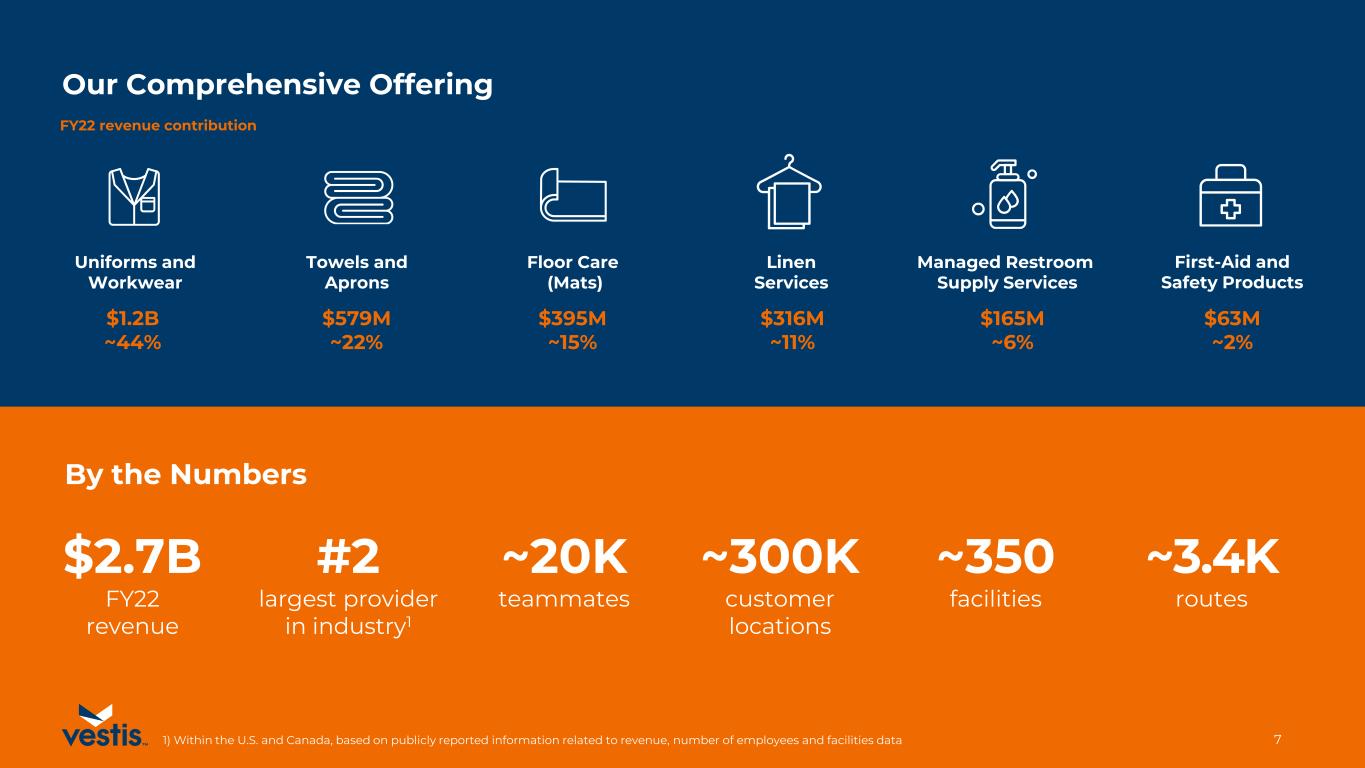
7TM Uniforms and Workwear First-Aid and Safety Products Managed Restroom Supply Services Floor Care (Mats) $1.2B ~44% $395M ~15% $316M ~11% $165M ~6% $63M ~2% $579M ~22% Towels and Aprons Linen Services Our Comprehensive Offering ~350 facilities ~3.4K routes ~300K customer locations ~20K teammates $2.7B FY22 revenue #2 largest provider in industry1 By the Numbers FY22 revenue contribution 1) Within the U.S. and Canada, based on publicly reported information related to revenue, number of employees and facilities data
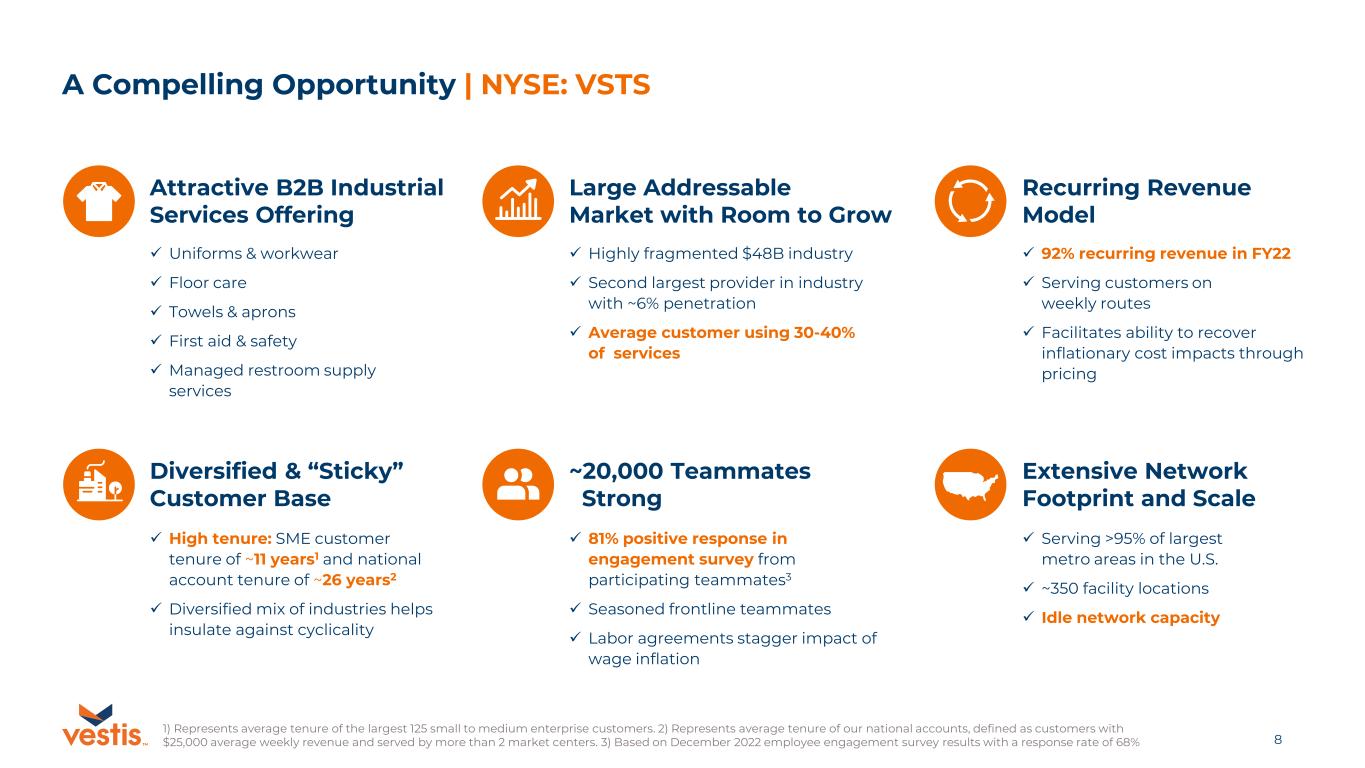
8TM A Compelling Opportunity | NYSE: VSTS Attractive B2B Industrial Services Offering ✓ Uniforms & workwear ✓ Floor care ✓ Towels & aprons ✓ First aid & safety ✓ Managed restroom supply services ~20,000 Teammates Strong ✓ 81% positive response in engagement survey from participating teammates3 ✓ Seasoned frontline teammates ✓ Labor agreements stagger impact of wage inflation Recurring Revenue Model ✓ 92% recurring revenue in FY22 ✓ Serving customers on weekly routes ✓ Facilitates ability to recover inflationary cost impacts through pricing Extensive Network Footprint and Scale ✓ Serving >95% of largest metro areas in the U.S. ✓ ~350 facility locations ✓ Idle network capacity Diversified & “Sticky” Customer Base ✓ High tenure: SME customer tenure of ~11 years1 and national account tenure of ~26 years2 ✓ Diversified mix of industries helps insulate against cyclicality Large Addressable Market with Room to Grow ✓ Highly fragmented $48B industry ✓ Second largest provider in industry with ~6% penetration ✓ Average customer using 30-40% of services 1) Represents average tenure of the largest 125 small to medium enterprise customers. 2) Represents average tenure of our national accounts, defined as customers with $25,000 average weekly revenue and served by more than 2 market centers. 3) Based on December 2022 employee engagement survey results with a response rate of 68%
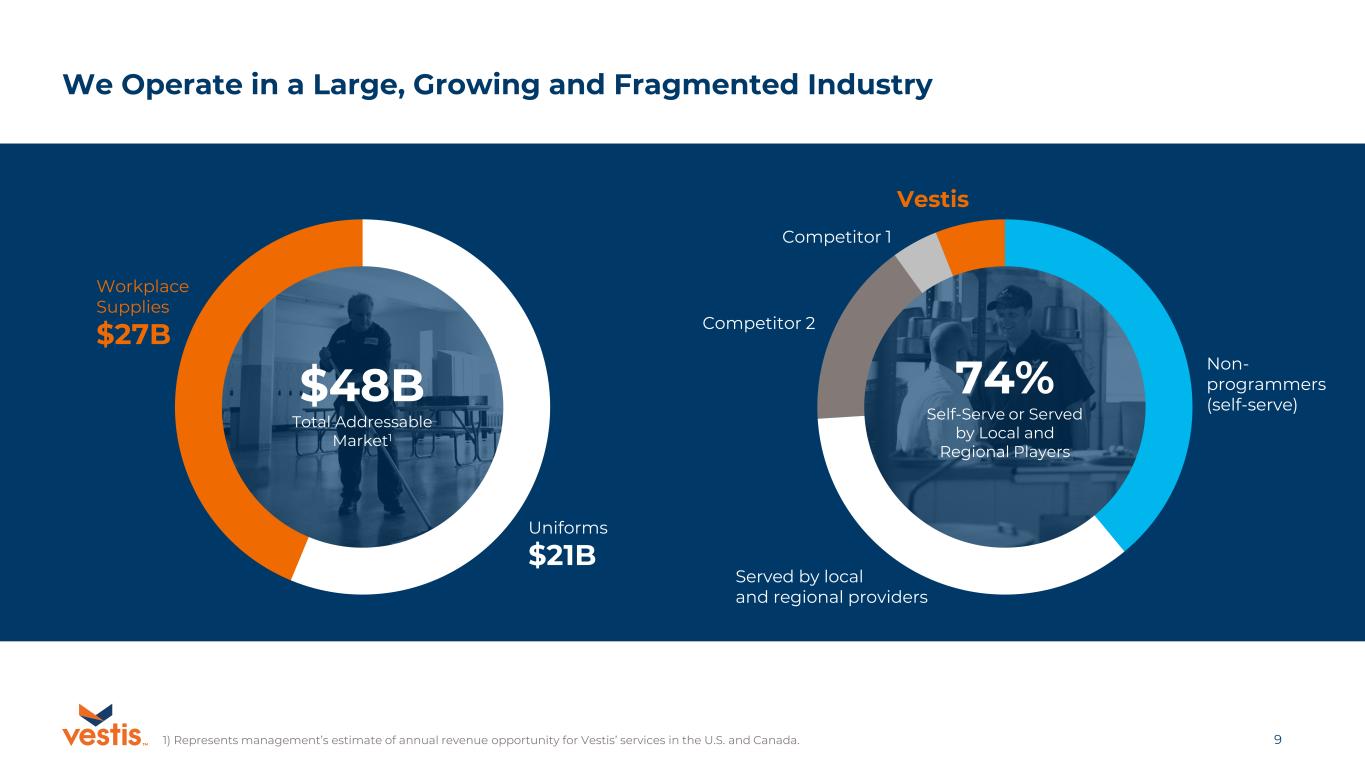
9TM Vestis Competitor 1 Competitor 2 74% Self-Serve or Served by Local and Regional Players Workplace Supplies $27B Uniforms $21B $48B Total Addressable Market1 We Operate in a Large, Growing and Fragmented Industry 1) Represents management’s estimate of annual revenue opportunity for Vestis’ services in the U.S. and Canada. Non- programmers (self-serve) Served by local and regional providers
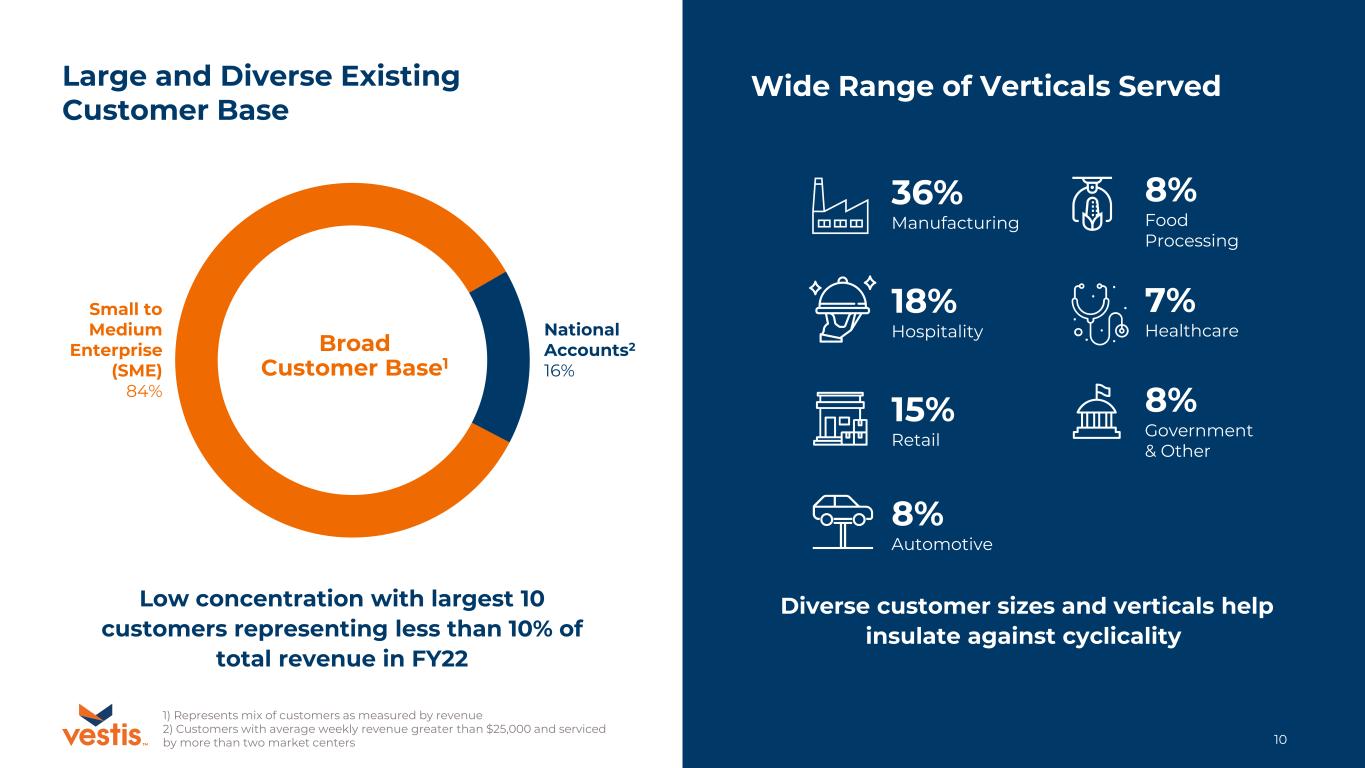
10TM Large and Diverse Existing Customer Base Wide Range of Verticals Served Small to Medium Enterprise (SME) 84% National Accounts2 16% Broad Customer Base1 Low concentration with largest 10 customers representing less than 10% of total revenue in FY22 36% Manufacturing 18% Hospitality 15% Retail 8% Automotive 8% Food Processing 8% Government & Other 7% Healthcare Diverse customer sizes and verticals help insulate against cyclicality 1) Represents mix of customers as measured by revenue 2) Customers with average weekly revenue greater than $25,000 and serviced by more than two market centers
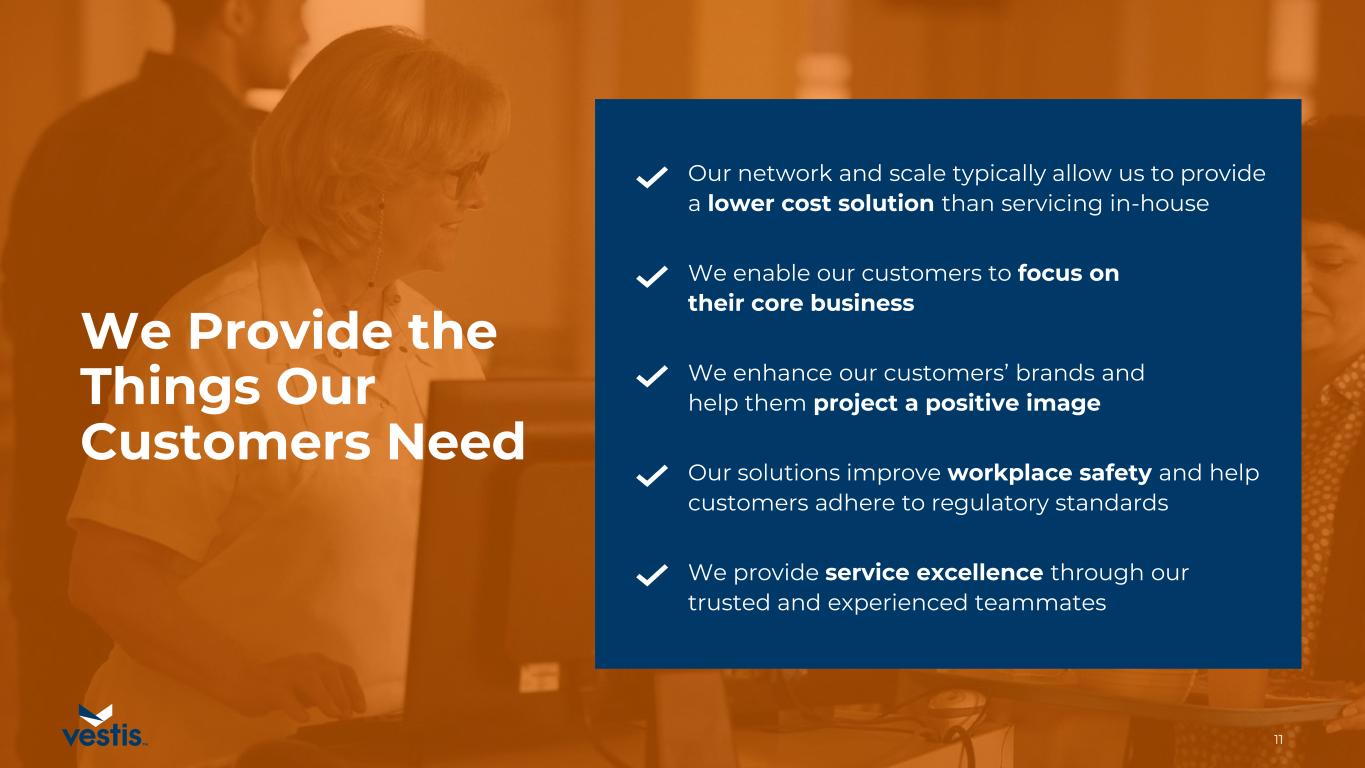
We Provide the Things Our Customers Need 11 Our network and scale typically allow us to provide a lower cost solution than servicing in-house We enable our customers to focus on their core business We enhance our customers’ brands and help them project a positive image Our solutions improve workplace safety and help customers adhere to regulatory standards We provide service excellence through our trusted and experienced teammates TM
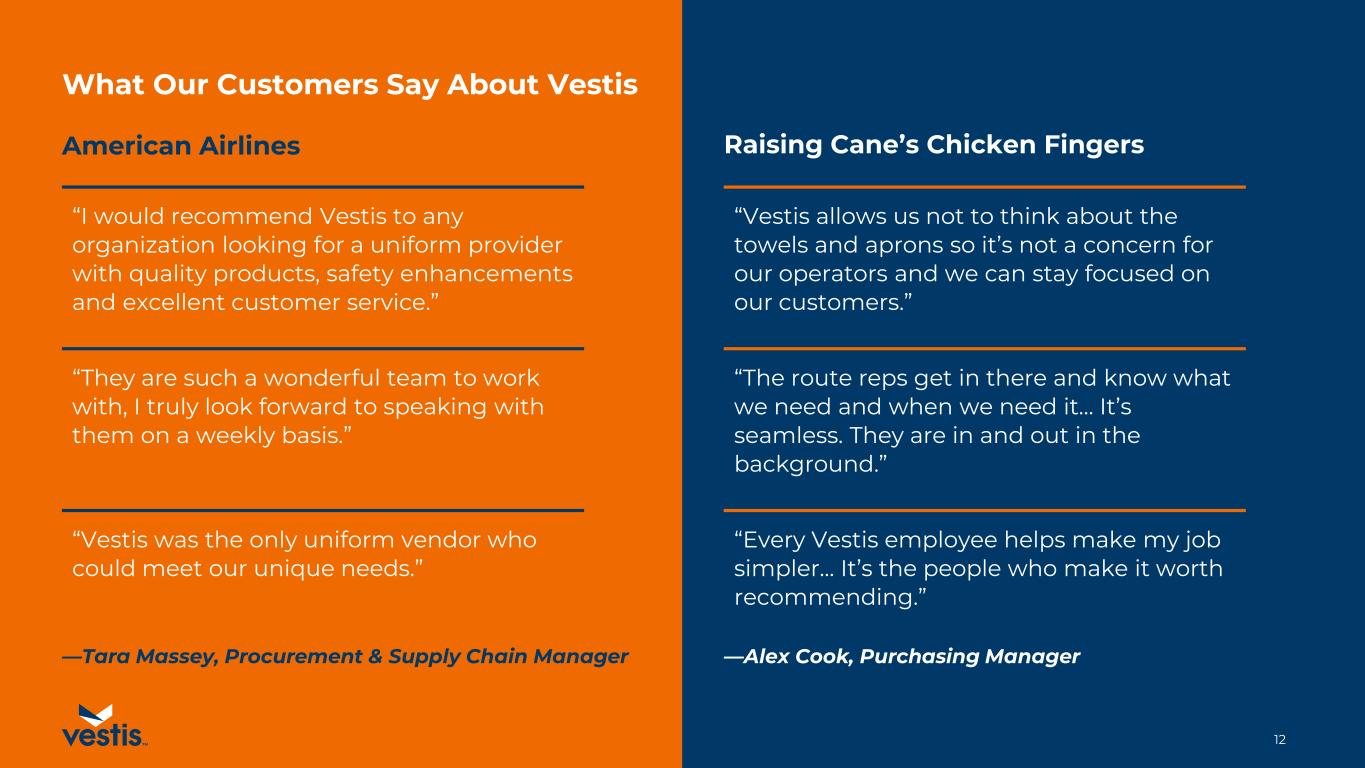
12TM —Alex Cook, Purchasing Manager “Every Vestis employee helps make my job simpler… It’s the people who make it worth recommending.” “The route reps get in there and know what we need and when we need it… It’s seamless. They are in and out in the background.” “Vestis allows us not to think about the towels and aprons so it’s not a concern for our operators and we can stay focused on our customers.” Raising Cane’s Chicken Fingers —Tara Massey, Procurement & Supply Chain Manager What Our Customers Say About Vestis “They are such a wonderful team to work with, I truly look forward to speaking with them on a weekly basis.” American Airlines “I would recommend Vestis to any organization looking for a uniform provider with quality products, safety enhancements and excellent customer service.” “Vestis was the only uniform vendor who could meet our unique needs.”

13TM PATHWAY TO VALUE CREATION
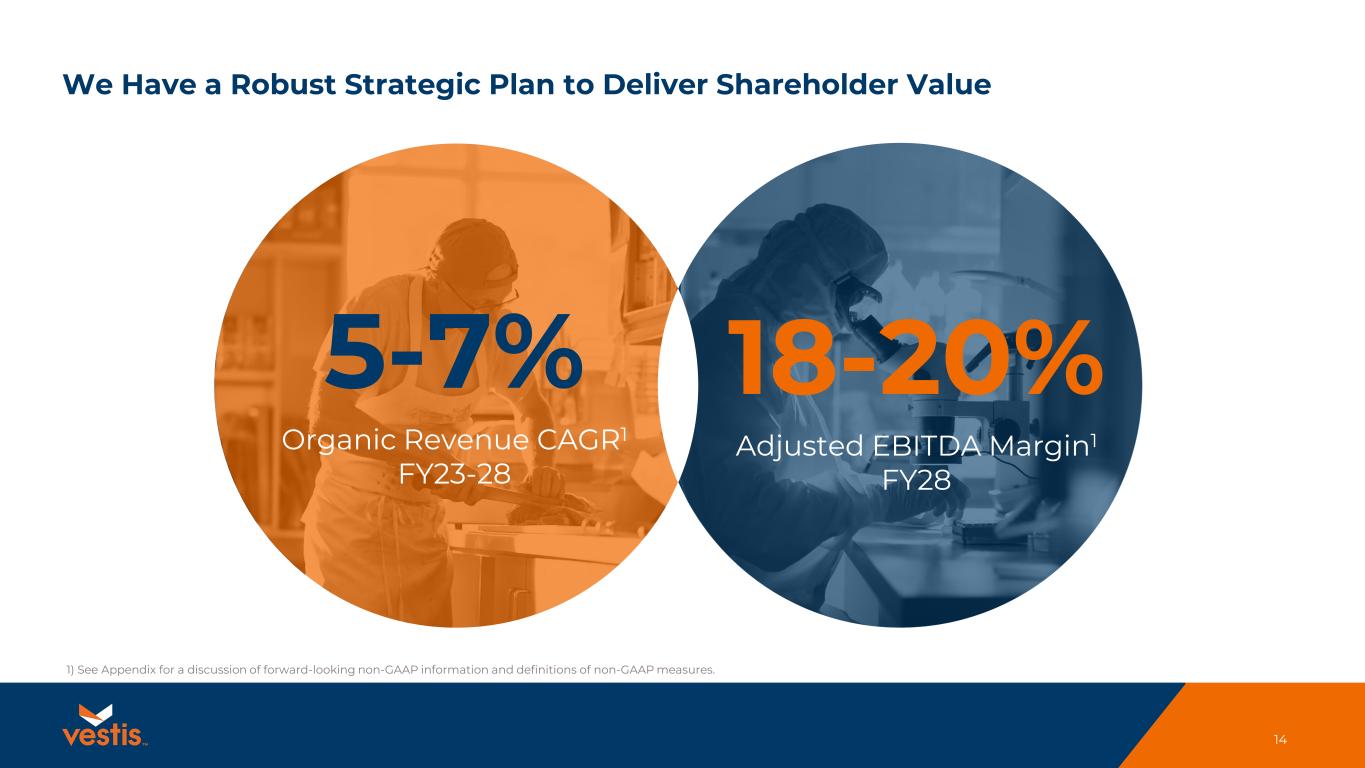
14TM We Have a Robust Strategic Plan to Deliver Shareholder Value 5-7% Organic Revenue CAGR1 FY23-28 18-20% Adjusted EBITDA Margin1 FY28 1) See Appendix for a discussion of forward-looking non-GAAP information and definitions of non-GAAP measures.
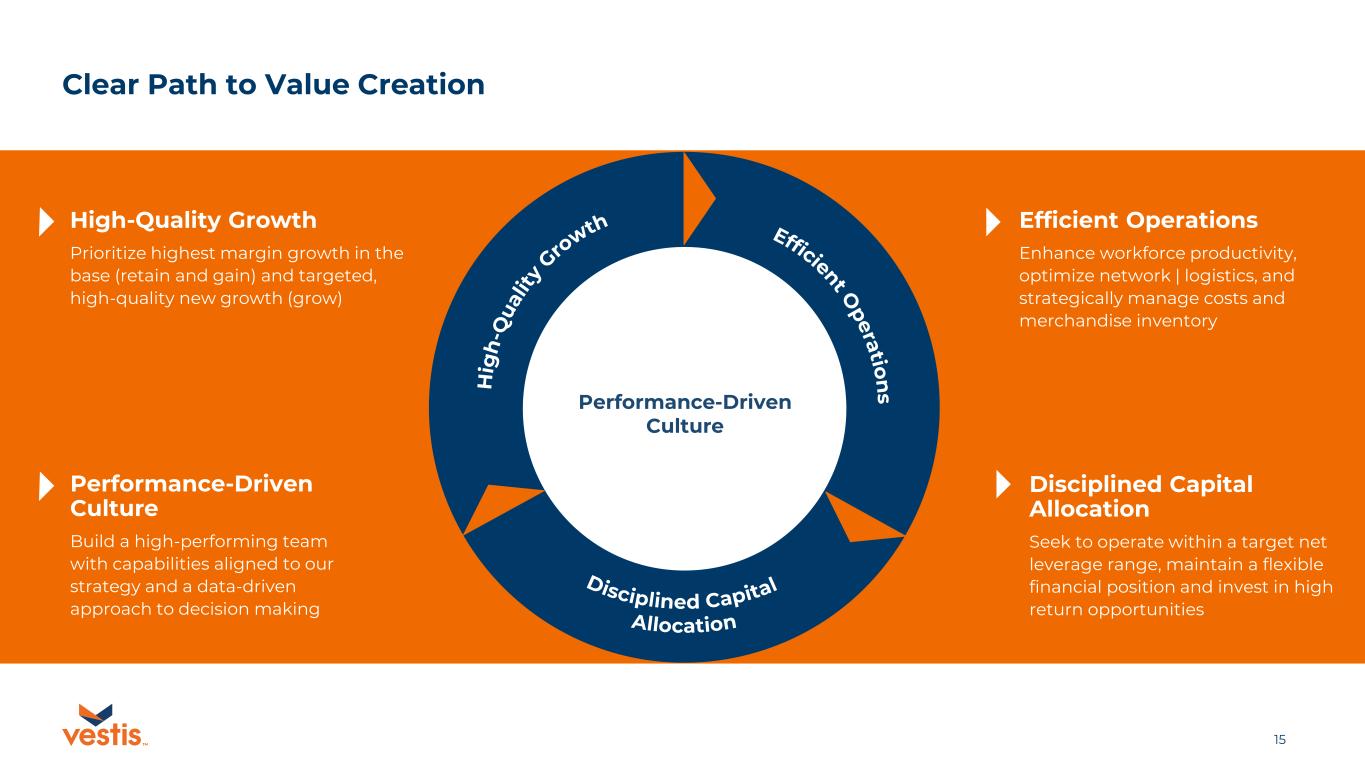
15TM Efficient O peratio n sH ig h -Q ua lit y Gro wth Disciplined Capital Allocation Performance-Driven Culture Performance-Driven Culture Build a high-performing team with capabilities aligned to our strategy and a data-driven approach to decision making High-Quality Growth Prioritize highest margin growth in the base (retain and gain) and targeted, high-quality new growth (grow) Efficient Operations Enhance workforce productivity, optimize network | logistics, and strategically manage costs and merchandise inventory Clear Path to Value Creation Disciplined Capital Allocation Seek to operate within a target net leverage range, maintain a flexible financial position and invest in high return opportunities
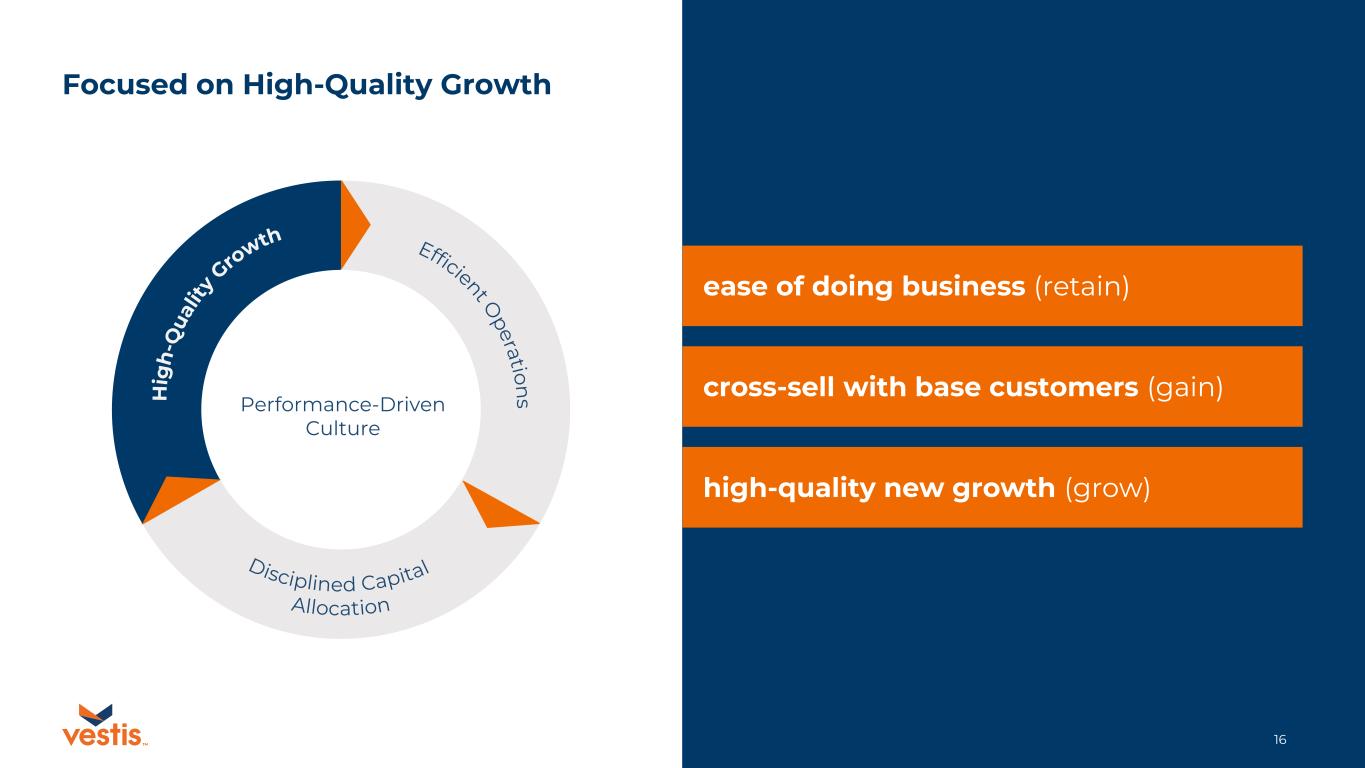
16TM Efficient O peration sH ig h -Q ua lit y Gro wth Disciplined Capital Allocation Performance-Driven Culture ease of doing business (retain) cross-sell with base customers (gain) high-quality new growth (grow) Focused on High-Quality Growth
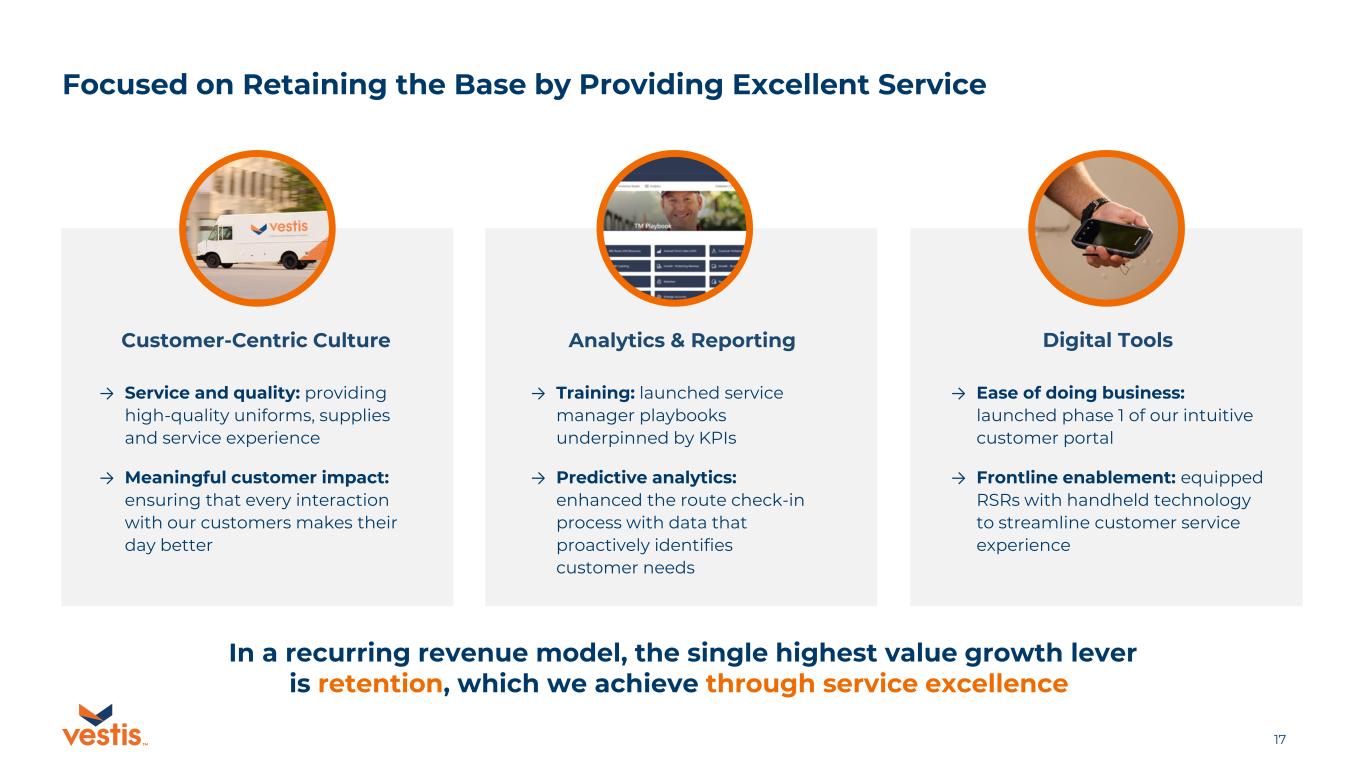
17TM Customer-Centric Culture Analytics & Reporting Digital Tools → Service and quality: providing high-quality uniforms, supplies and service experience → Meaningful customer impact: ensuring that every interaction with our customers makes their day better → Training: launched service manager playbooks underpinned by KPIs → Predictive analytics: enhanced the route check-in process with data that proactively identifies customer needs → Ease of doing business: launched phase 1 of our intuitive customer portal → Frontline enablement: equipped RSRs with handheld technology to streamline customer service experience Focused on Retaining the Base by Providing Excellent Service In a recurring revenue model, the single highest value growth lever is retention, which we achieve through service excellence
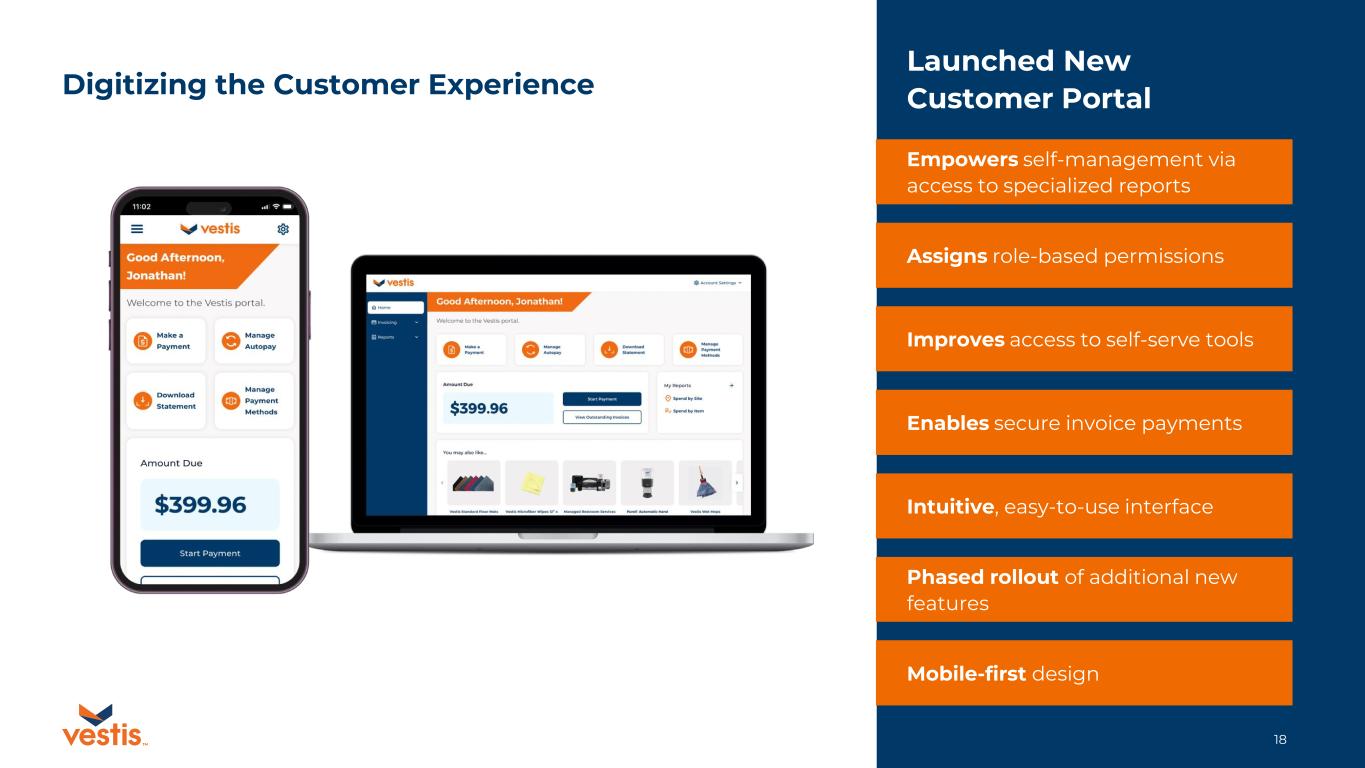
18TM Launched New Customer Portal Digitizing the Customer Experience Empowers self-management via access to specialized reports Assigns role-based permissions Improves access to self-serve tools Enables secure invoice payments Intuitive, easy-to-use interface Phased rollout of additional new features Mobile-first design
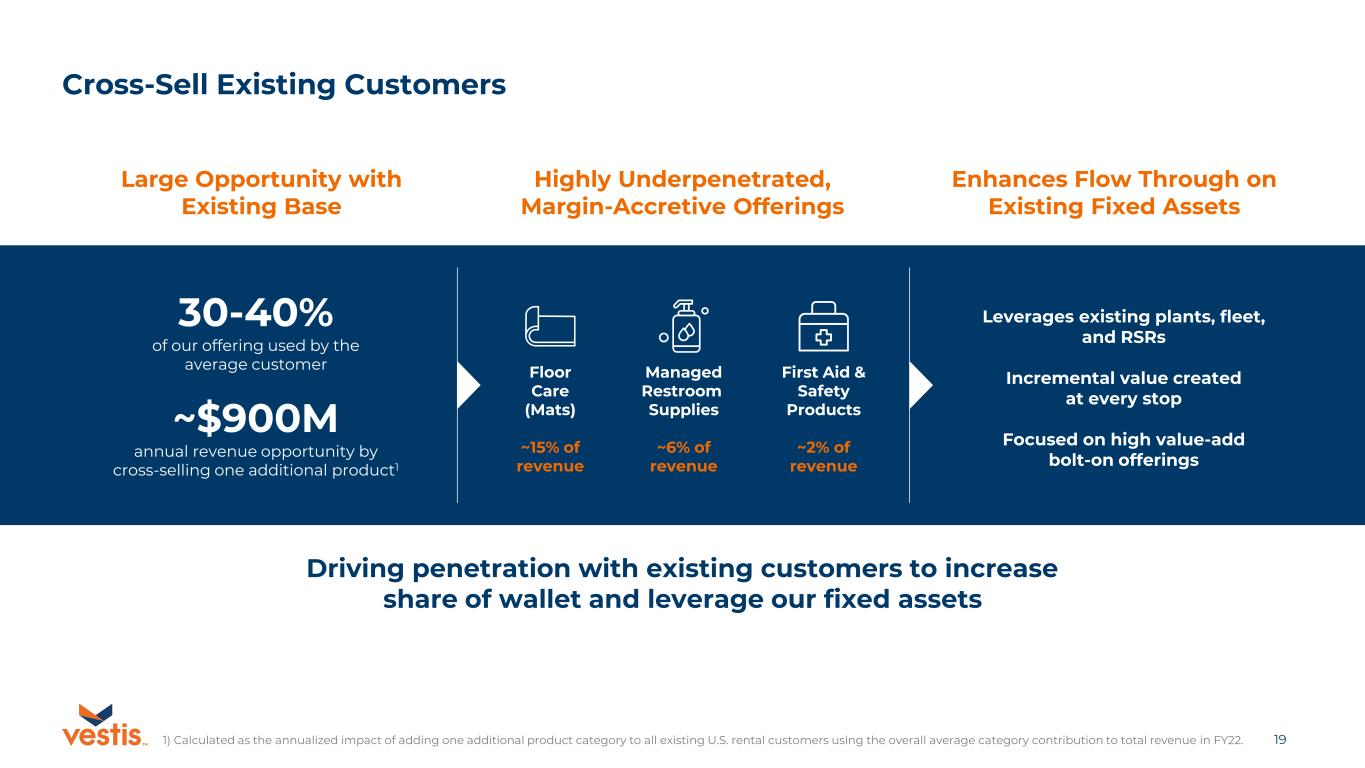
19TM Highly Underpenetrated, Margin-Accretive Offerings Large Opportunity with Existing Base Enhances Flow Through on Existing Fixed Assets Cross-Sell Existing Customers 30-40% of our offering used by the average customer ~$900M annual revenue opportunity by cross-selling one additional product1 Driving penetration with existing customers to increase share of wallet and leverage our fixed assets Managed Restroom Supplies ~6% of revenue Leverages existing plants, fleet, and RSRs Incremental value created at every stop Focused on high value-add bolt-on offerings Floor Care (Mats) ~15% of revenue First Aid & Safety Products ~2% of revenue 1) Calculated as the annualized impact of adding one additional product category to all existing U.S. rental customers using the overall average category contribution to total revenue in FY22.
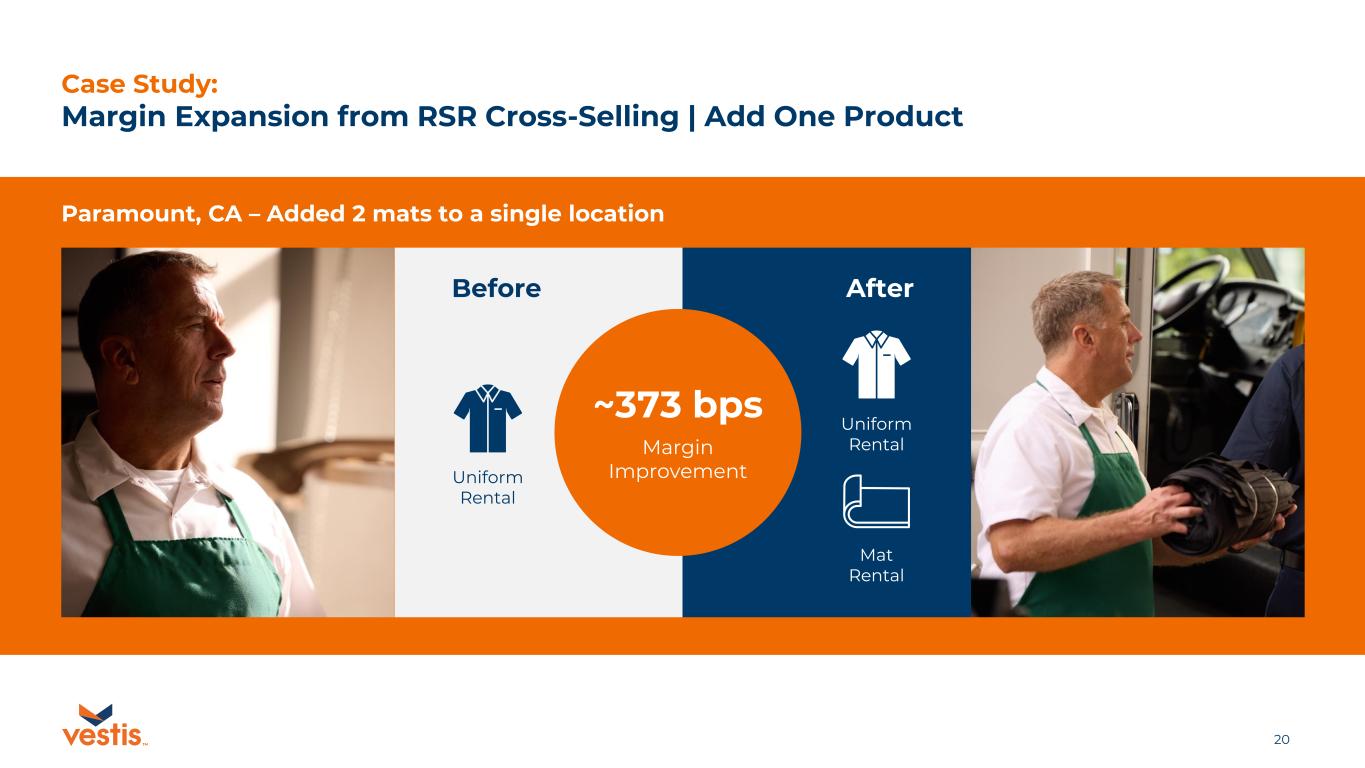
20TM Case Study: Margin Expansion from RSR Cross-Selling | Add One Product Before Uniform Rental After ~373 bps Margin Improvement Uniform Rental Mat Rental Paramount, CA – Added 2 mats to a single location
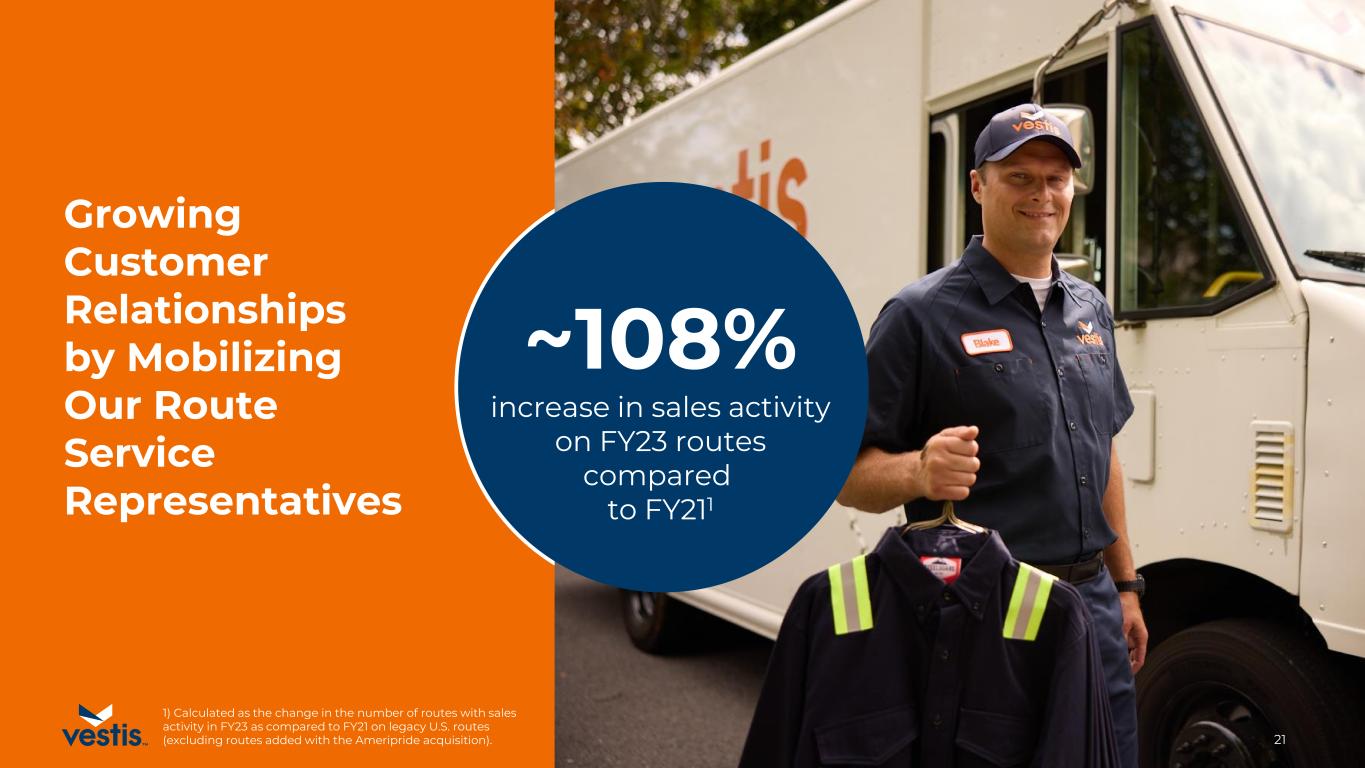
21TM Growing Customer Relationships by Mobilizing Our Route Service Representatives ~108% increase in sales activity on FY23 routes compared to FY211 1) Calculated as the change in the number of routes with sales activity in FY23 as compared to FY21 on legacy U.S. routes (excluding routes added with the Ameripride acquisition).
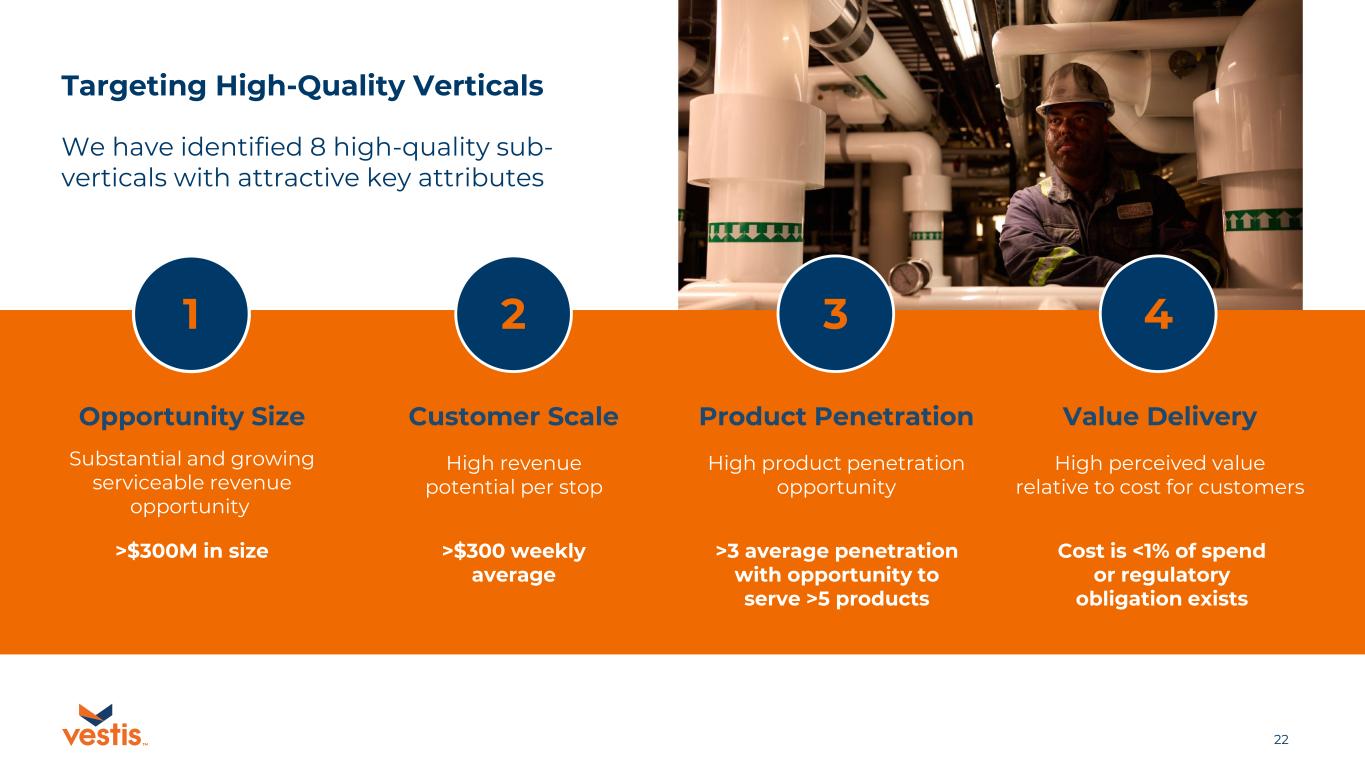
22TM Targeting High-Quality Verticals We have identified 8 high-quality sub- verticals with attractive key attributes 1 2 3 4 Opportunity Size Substantial and growing serviceable revenue opportunity High revenue potential per stop Customer Scale High product penetration opportunity Product Penetration High perceived value relative to cost for customers Value Delivery >$300M in size >$300 weekly average >3 average penetration with opportunity to serve >5 products Cost is <1% of spend or regulatory obligation exists
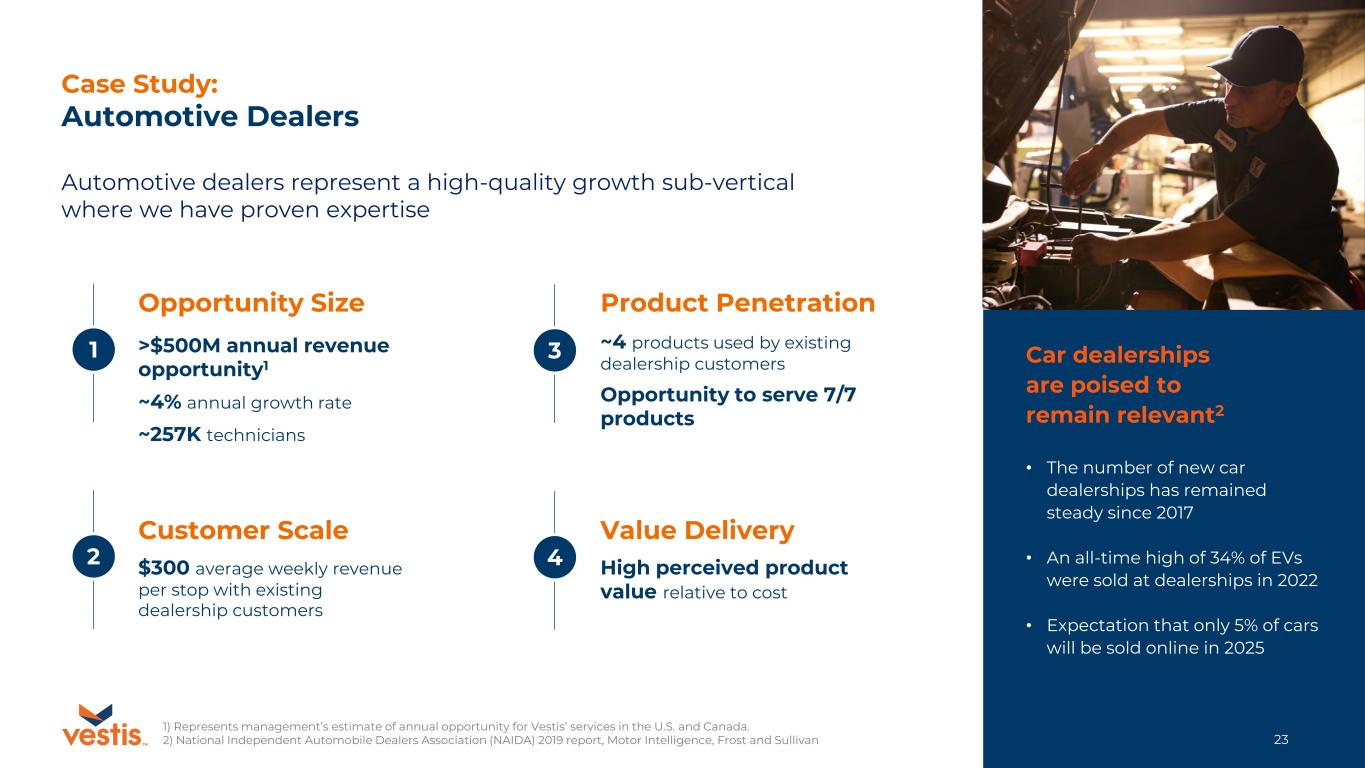
23TM Case Study: Automotive Dealers Automotive dealers represent a high-quality growth sub-vertical where we have proven expertise Opportunity Size Product Penetration >$500M annual revenue opportunity1 ~4% annual growth rate ~257K technicians $300 average weekly revenue per stop with existing dealership customers Customer Scale ~4 products used by existing dealership customers Opportunity to serve 7/7 products Value Delivery High perceived product value relative to cost Car dealerships are poised to remain relevant2 • The number of new car dealerships has remained steady since 2017 • An all-time high of 34% of EVs were sold at dealerships in 2022 • Expectation that only 5% of cars will be sold online in 2025 1 2 3 4 1) Represents management’s estimate of annual opportunity for Vestis’ services in the U.S. and Canada. 2) National Independent Automobile Dealers Association (NAIDA) 2019 report, Motor Intelligence, Frost and Sullivan
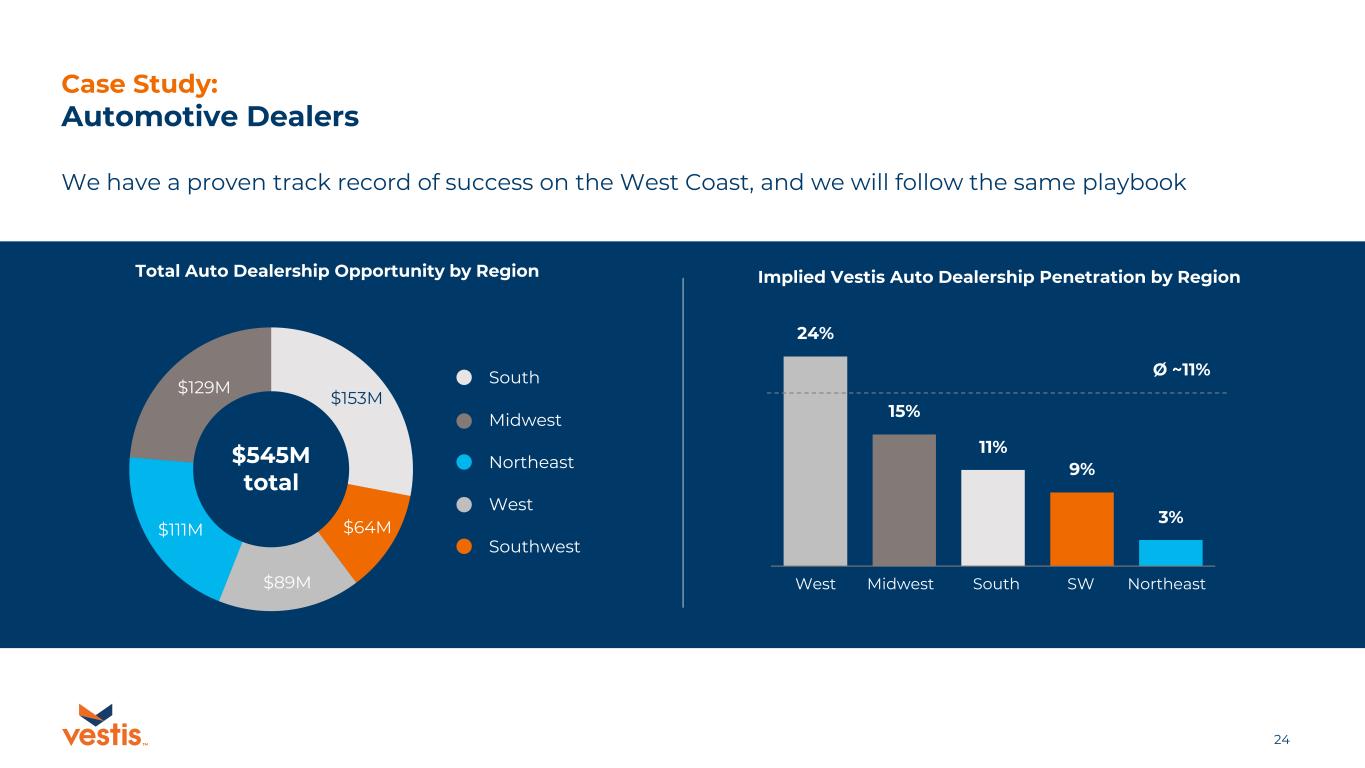
24TM Case Study: Automotive Dealers We have a proven track record of success on the West Coast, and we will follow the same playbook Total Auto Dealership Opportunity by Region Implied Vestis Auto Dealership Penetration by Region $153M $64M $89M $111M $129M $545M total 24% 15% 11% 9% 3% West NortheastMidwest South SW Ø ~11% Midwest West South Southwest Northeast
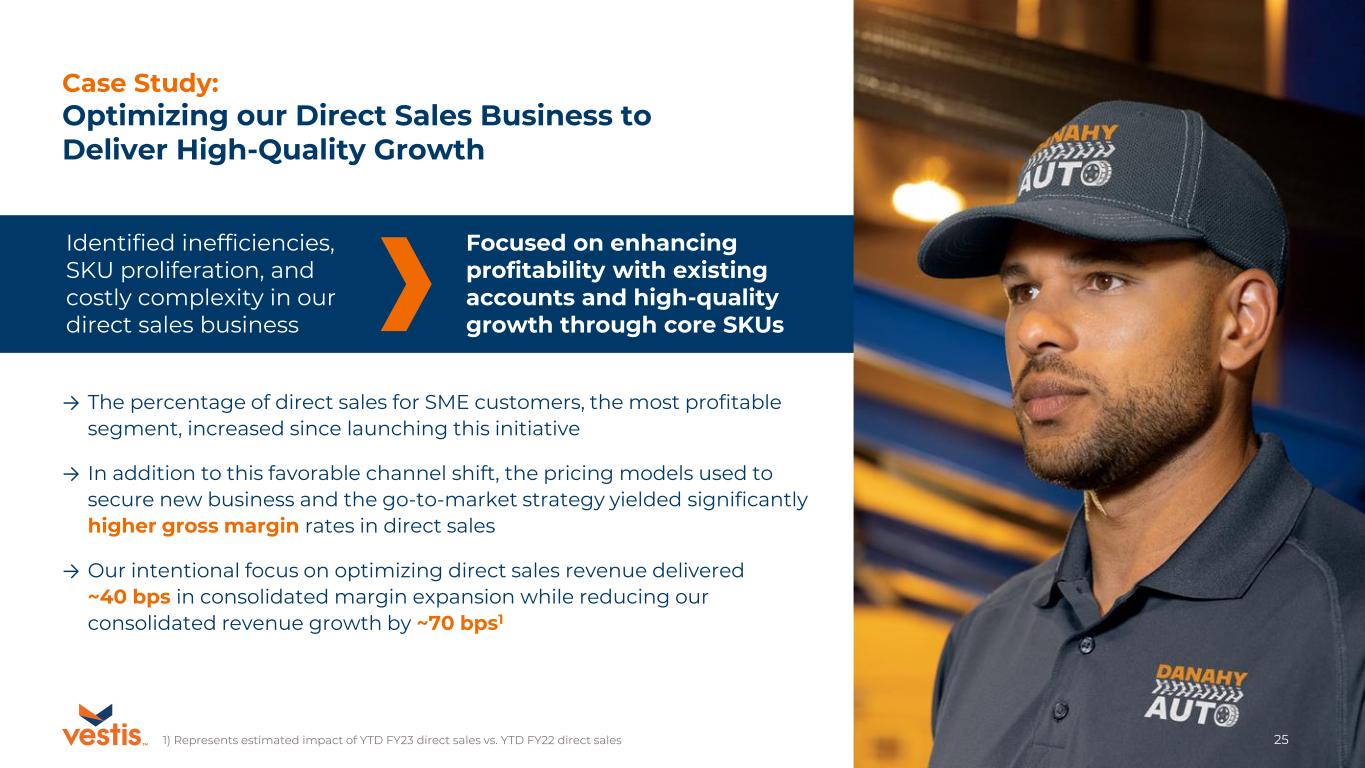
25TM → The percentage of direct sales for SME customers, the most profitable segment, increased since launching this initiative → In addition to this favorable channel shift, the pricing models used to secure new business and the go-to-market strategy yielded significantly higher gross margin rates in direct sales → Our intentional focus on optimizing direct sales revenue delivered ~40 bps in consolidated margin expansion while reducing our consolidated revenue growth by ~70 bps1 Case Study: Optimizing our Direct Sales Business to Deliver High-Quality Growth Focused on enhancing profitability with existing accounts and high-quality growth through core SKUs Identified inefficiencies, SKU proliferation, and costly complexity in our direct sales business 1) Represents estimated impact of YTD FY23 direct sales vs. YTD FY22 direct sales
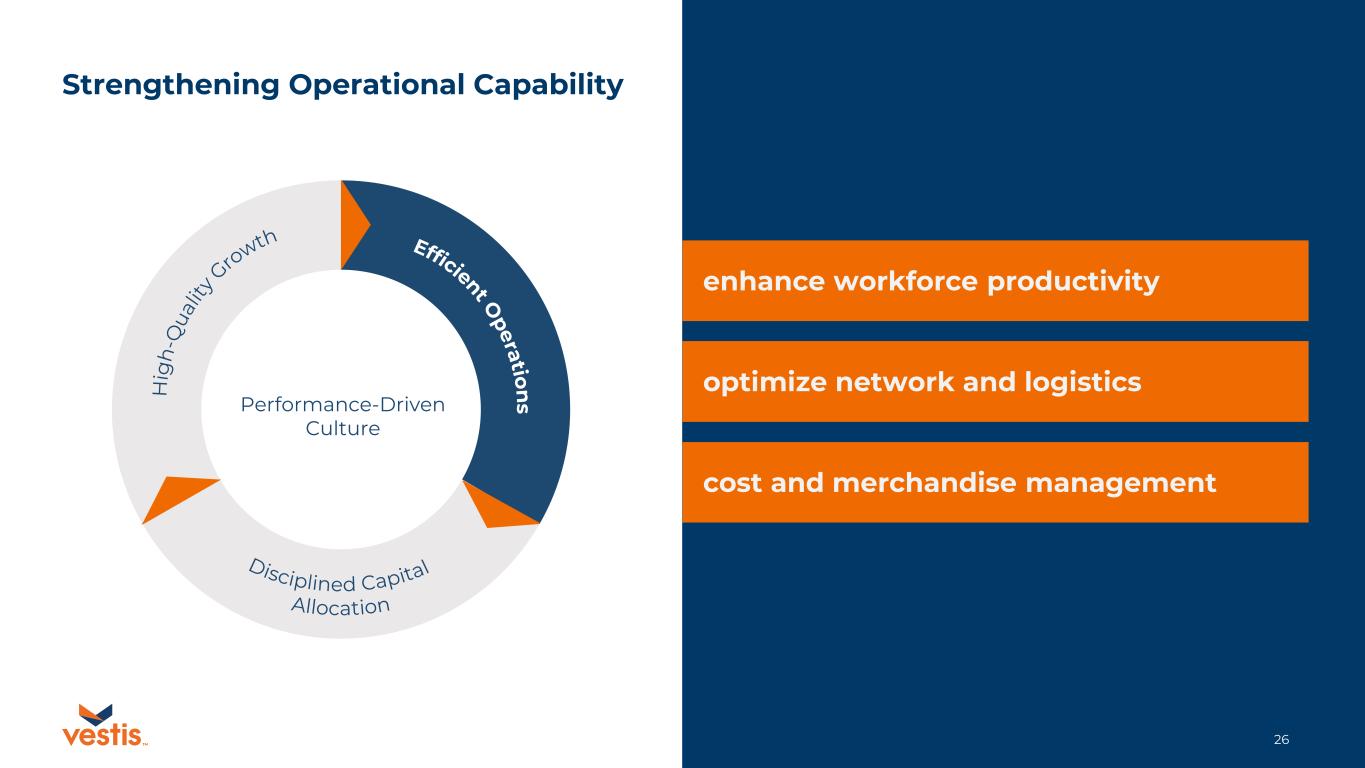
26TM Efficient O peratio n sH ig h -Q ua lit y Gro wth Disciplined Capital Allocation enhance workforce productivity optimize network and logistics cost and merchandise management Strengthening Operational Capability Performance-Driven Culture
27TM ~$28M in sustainable annualized savings from actions taken in FY23 to streamline our operations and deliver operating efficiencies Field Team Optimization Functional Alignment Regional Consolidation Shared Services Optimization Case Study: Enhancing Workforce Productivity Aligning Our Team for Success and Establishing a More Efficient Organizational Structure
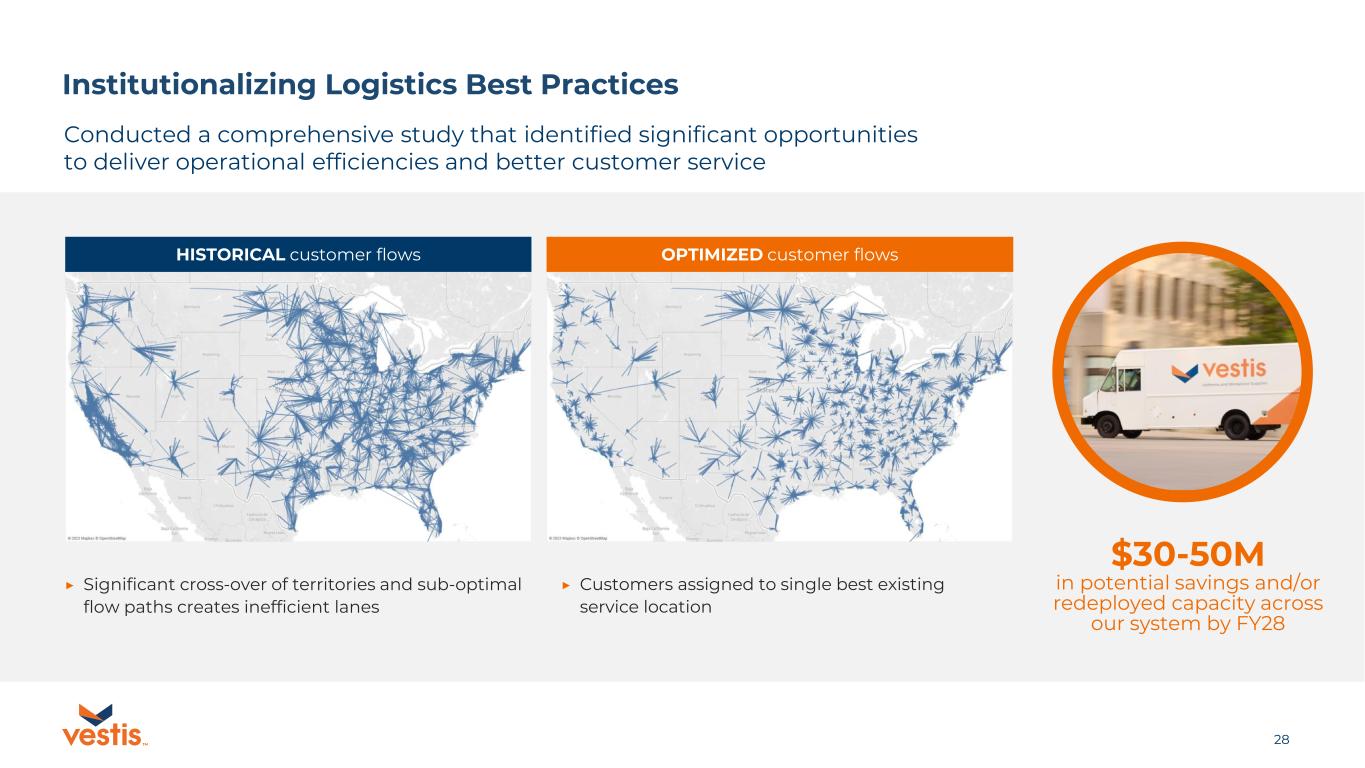
28TM ▶ Significant cross-over of territories and sub-optimal flow paths creates inefficient lanes ▶ Customers assigned to single best existing service location $30-50M in potential savings and/or redeployed capacity across our system by FY28 HISTORICAL customer flows OPTIMIZED customer flows Institutionalizing Logistics Best Practices Conducted a comprehensive study that identified significant opportunities to deliver operational efficiencies and better customer service
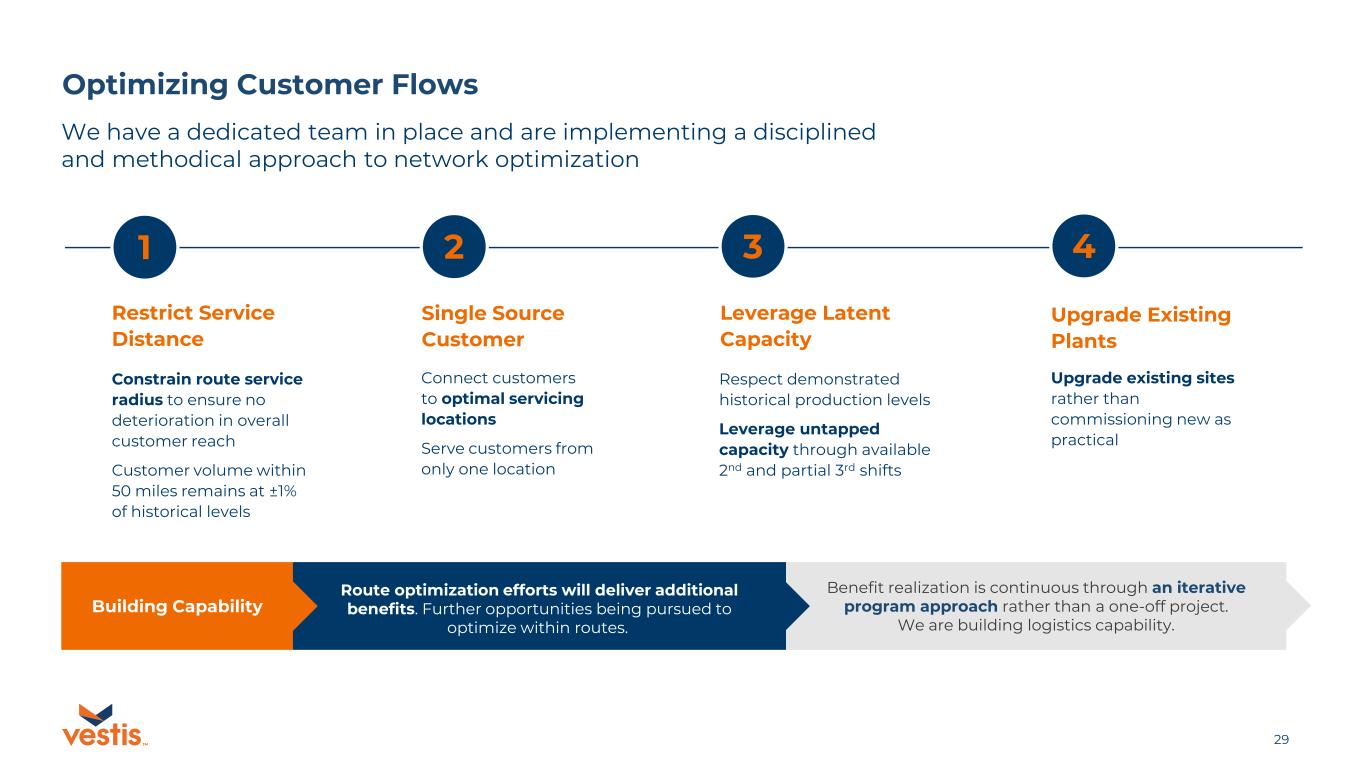
29TM Optimizing Customer Flows We have a dedicated team in place and are implementing a disciplined and methodical approach to network optimization 1 Constrain route service radius to ensure no deterioration in overall customer reach Customer volume within 50 miles remains at ±1% of historical levels Restrict Service Distance 2 Connect customers to optimal servicing locations Serve customers from only one location Single Source Customer 3 4 Respect demonstrated historical production levels Leverage untapped capacity through available 2nd and partial 3rd shifts Leverage Latent Capacity Upgrade Existing Plants Upgrade existing sites rather than commissioning new as practical Building Capability Route optimization efforts will deliver additional benefits. Further opportunities being pursued to optimize within routes. Benefit realization is continuous through an iterative program approach rather than a one-off project. We are building logistics capability.
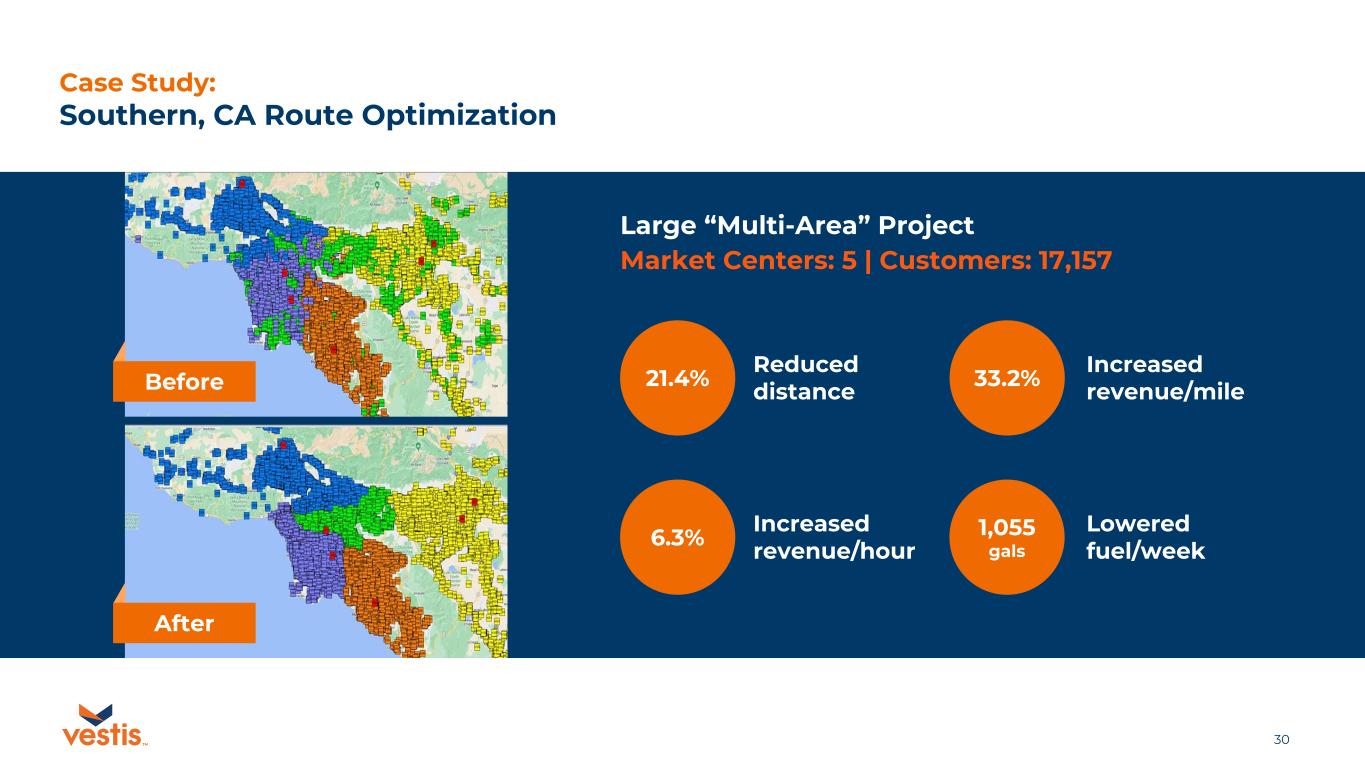
30TM Large “Multi-Area” Project Market Centers: 5 | Customers: 17,157 21.4% 33.2% 6.3% 1,055 gals Reduced distance Increased revenue/hour Increased revenue/mile Lowered fuel/week Case Study: Southern, CA Route Optimization Before After
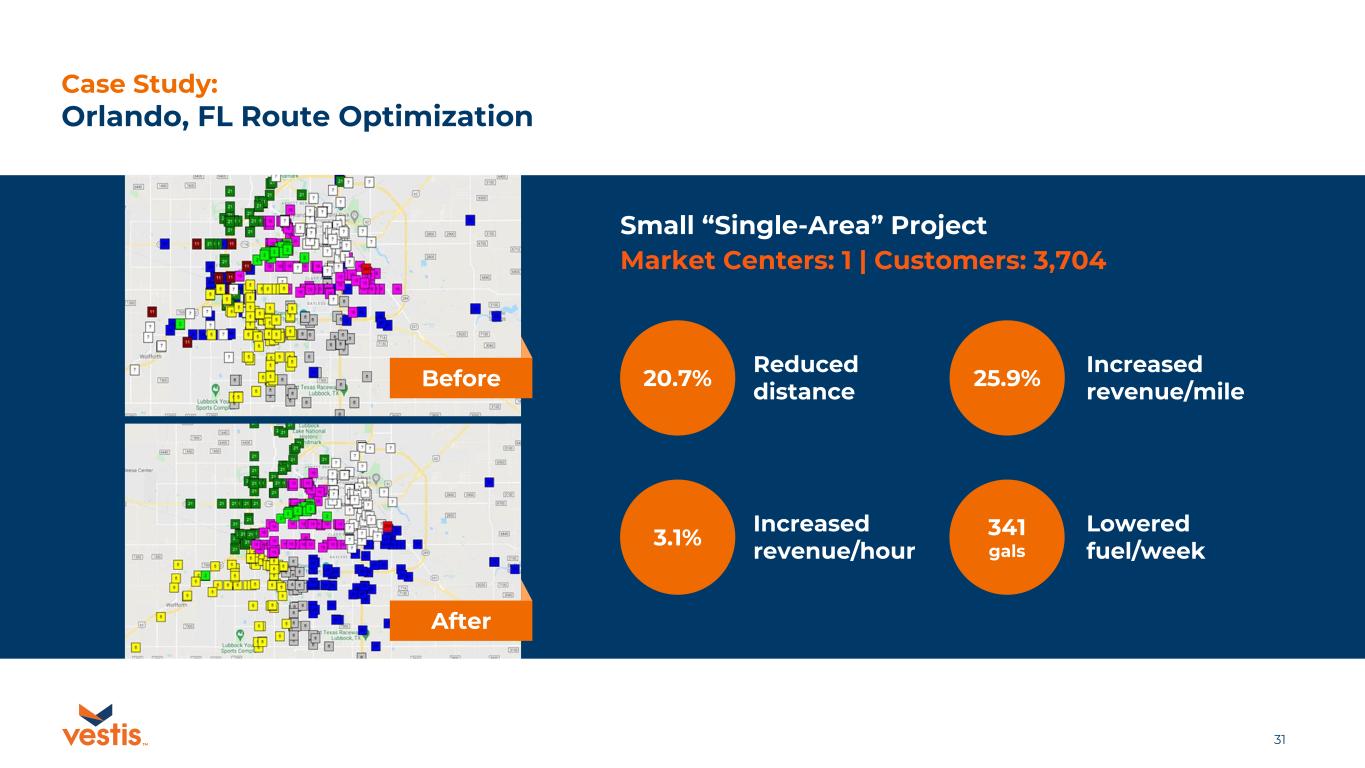
31TM Case Study: Orlando, FL Route Optimization Before After Small “Single-Area” Project Market Centers: 1 | Customers: 3,704 20.7% 25.9% 3.1% 341 gals Reduced distance Increased revenue/hour Increased revenue/mile Lowered fuel/week
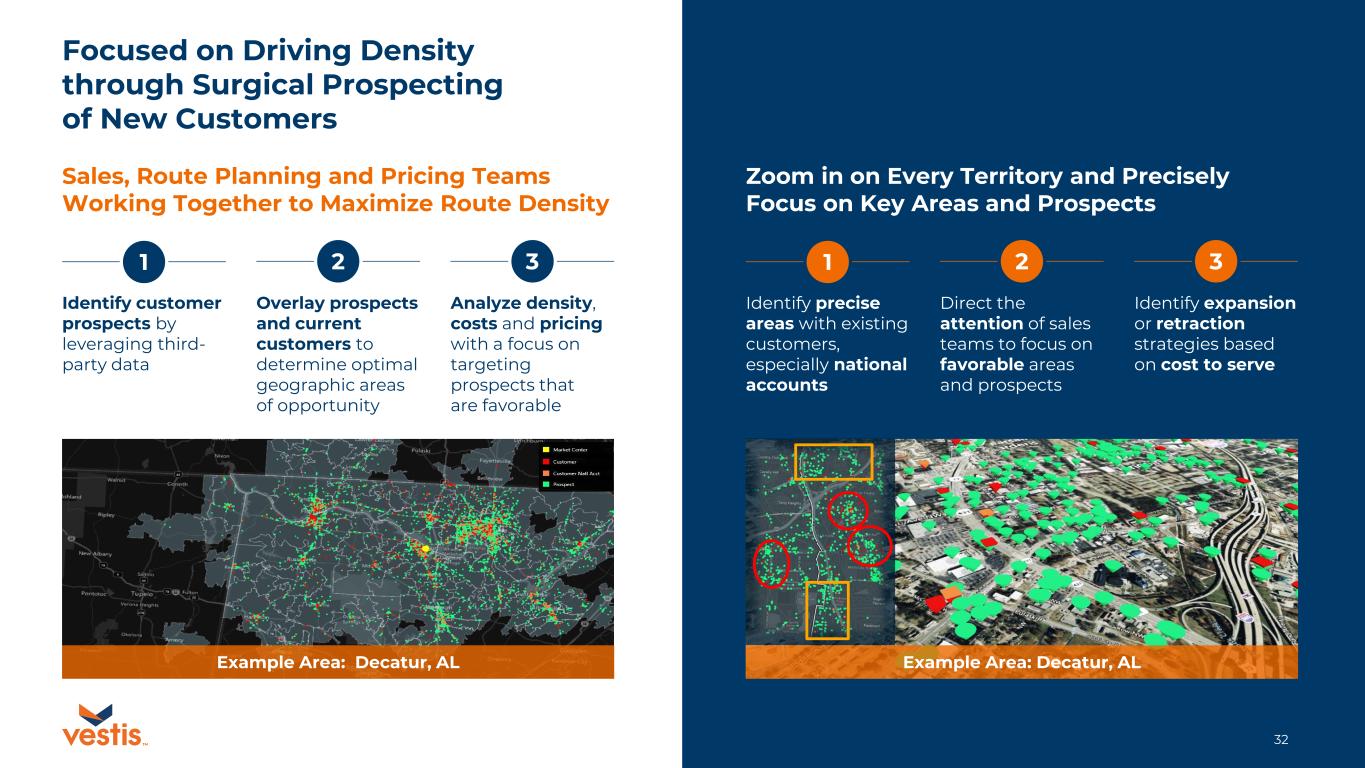
32TM Focused on Driving Density through Surgical Prospecting of New Customers Sales, Route Planning and Pricing Teams Working Together to Maximize Route Density 1 Identify customer prospects by leveraging third- party data 2 Overlay prospects and current customers to determine optimal geographic areas of opportunity 3 Analyze density, costs and pricing with a focus on targeting prospects that are favorable Zoom in on Every Territory and Precisely Focus on Key Areas and Prospects 1 Identify precise areas with existing customers, especially national accounts 2 Direct the attention of sales teams to focus on favorable areas and prospects 3 Identify expansion or retraction strategies based on cost to serve Example Area: Decatur, AL Example Area: Decatur, AL
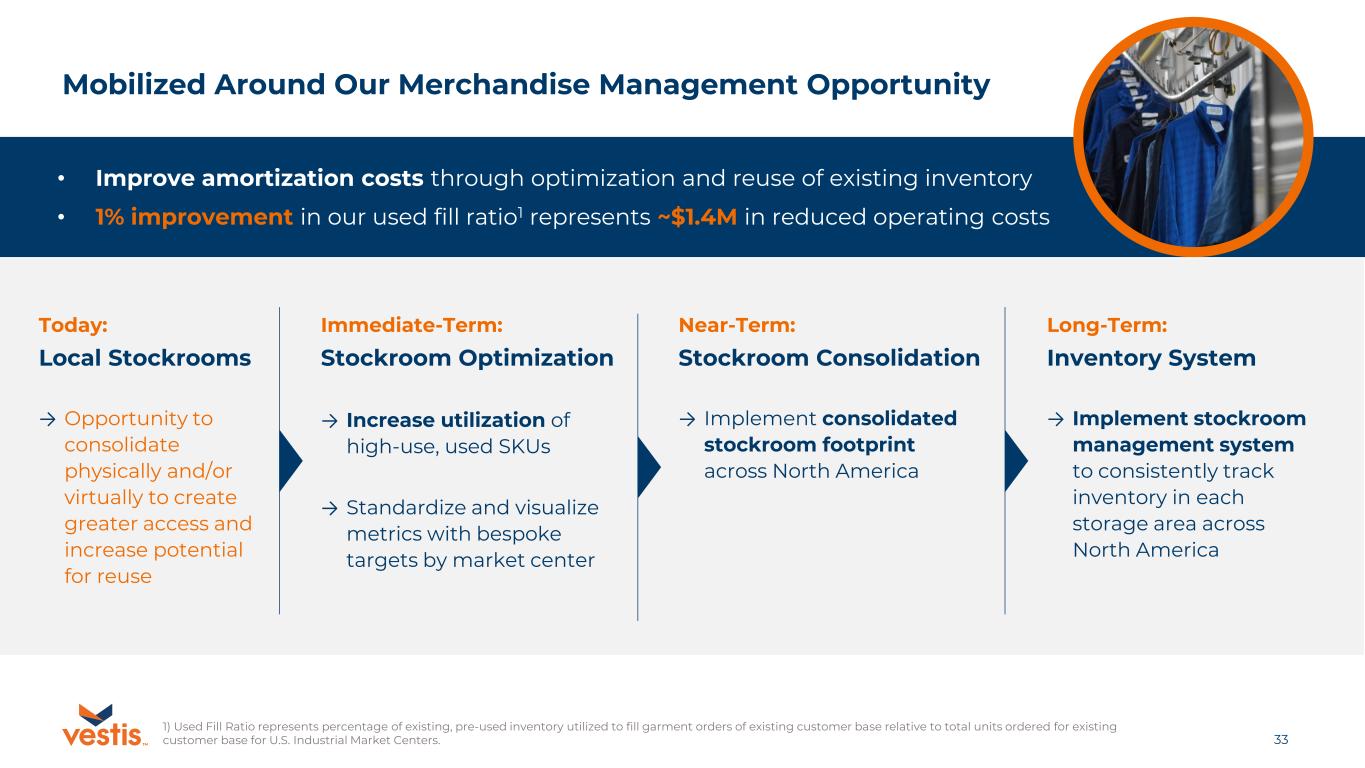
33TM Mobilized Around Our Merchandise Management Opportunity Today: Long-Term:Immediate-Term: Stockroom Optimization → Increase utilization of high-use, used SKUs → Standardize and visualize metrics with bespoke targets by market center Stockroom Consolidation → Implement consolidated stockroom footprint across North America Inventory System → Implement stockroom management system to consistently track inventory in each storage area across North America Local Stockrooms → Opportunity to consolidate physically and/or virtually to create greater access and increase potential for reuse • Improve amortization costs through optimization and reuse of existing inventory • 1% improvement in our used fill ratio1 represents ~$1.4M in reduced operating costs Near-Term: 1) Used Fill Ratio represents percentage of existing, pre-used inventory utilized to fill garment orders of existing customer base relative to total units ordered for existing customer base for U.S. Industrial Market Centers.
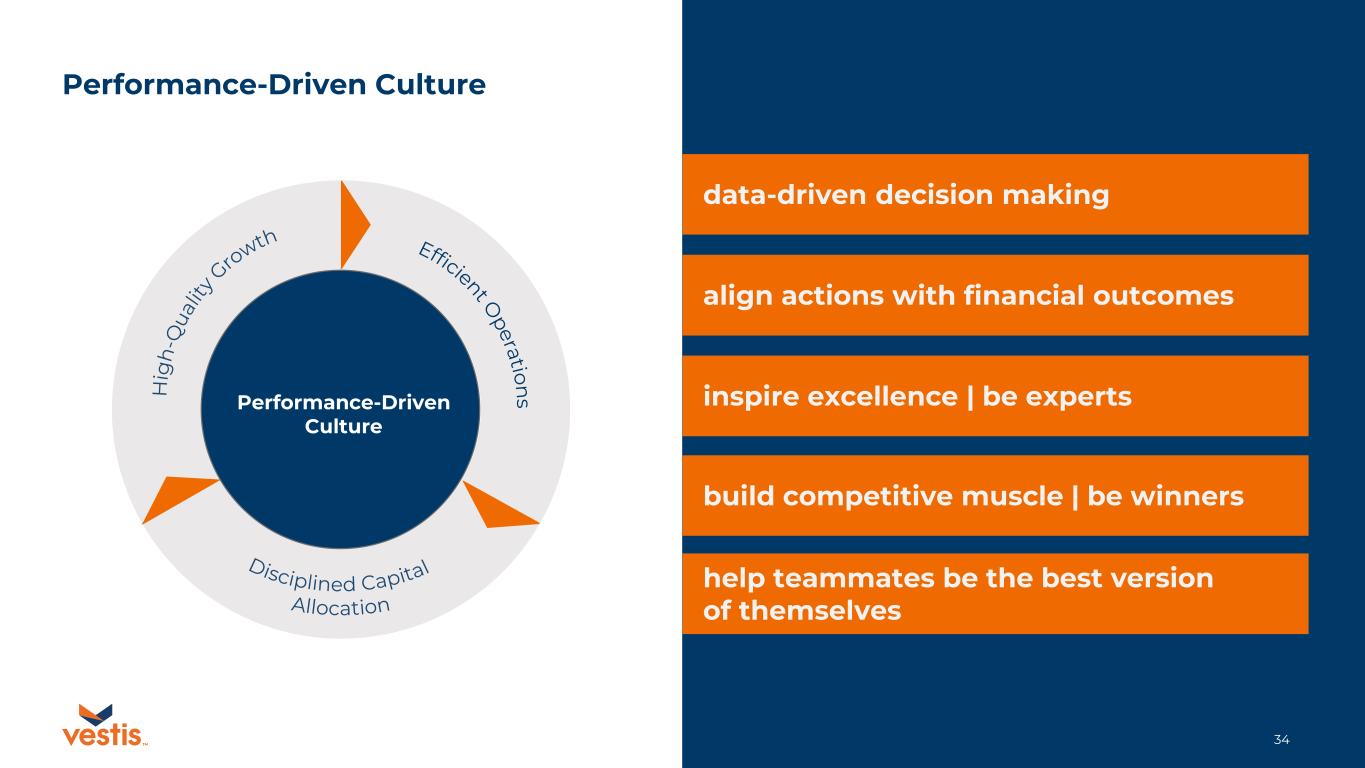
34TM data-driven decision making align actions with financial outcomes inspire excellence | be experts build competitive muscle | be winners help teammates be the best version of themselves Efficient O peration sH ig h -Q ua lit y Gro wth Disciplined Capital Allocation Performance-Driven Culture Performance-Driven Culture
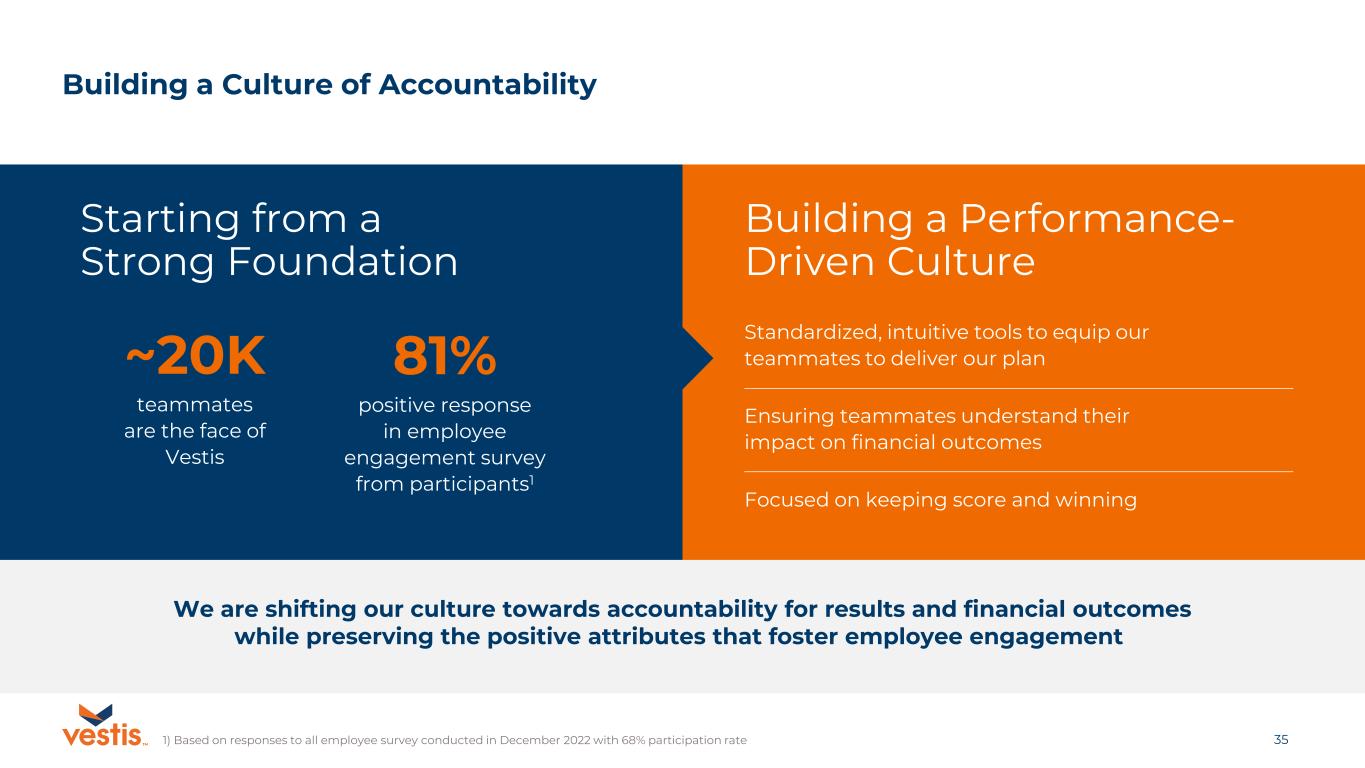
35TM Starting from a Strong Foundation Building a Performance- Driven Culture Building a Culture of Accountability We are shifting our culture towards accountability for results and financial outcomes while preserving the positive attributes that foster employee engagement Standardized, intuitive tools to equip our teammates to deliver our plan Ensuring teammates understand their impact on financial outcomes Focused on keeping score and winning 81% positive response in employee engagement survey from participants1 ~20K teammates are the face of Vestis 1) Based on responses to all employee survey conducted in December 2022 with 68% participation rate
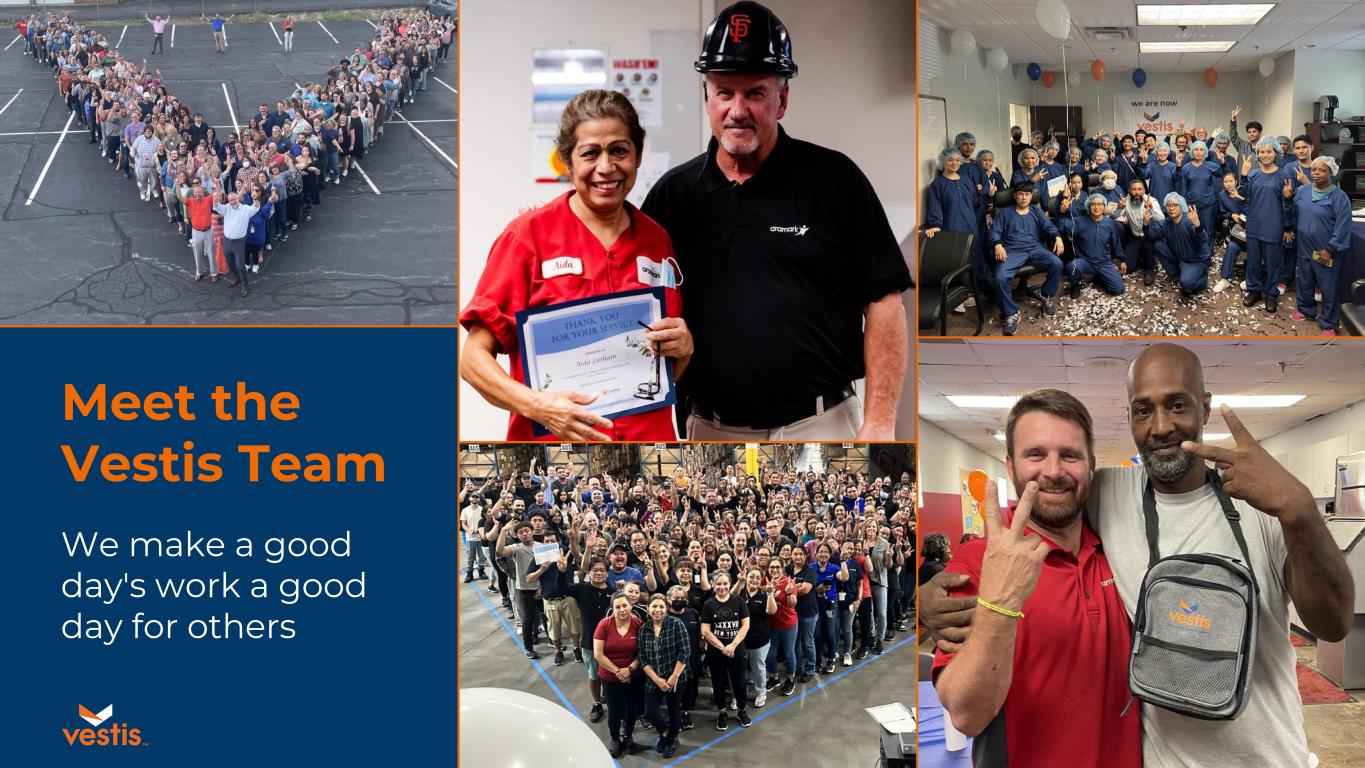
36TM We make a good day's work a good day for others Meet the Vestis Team
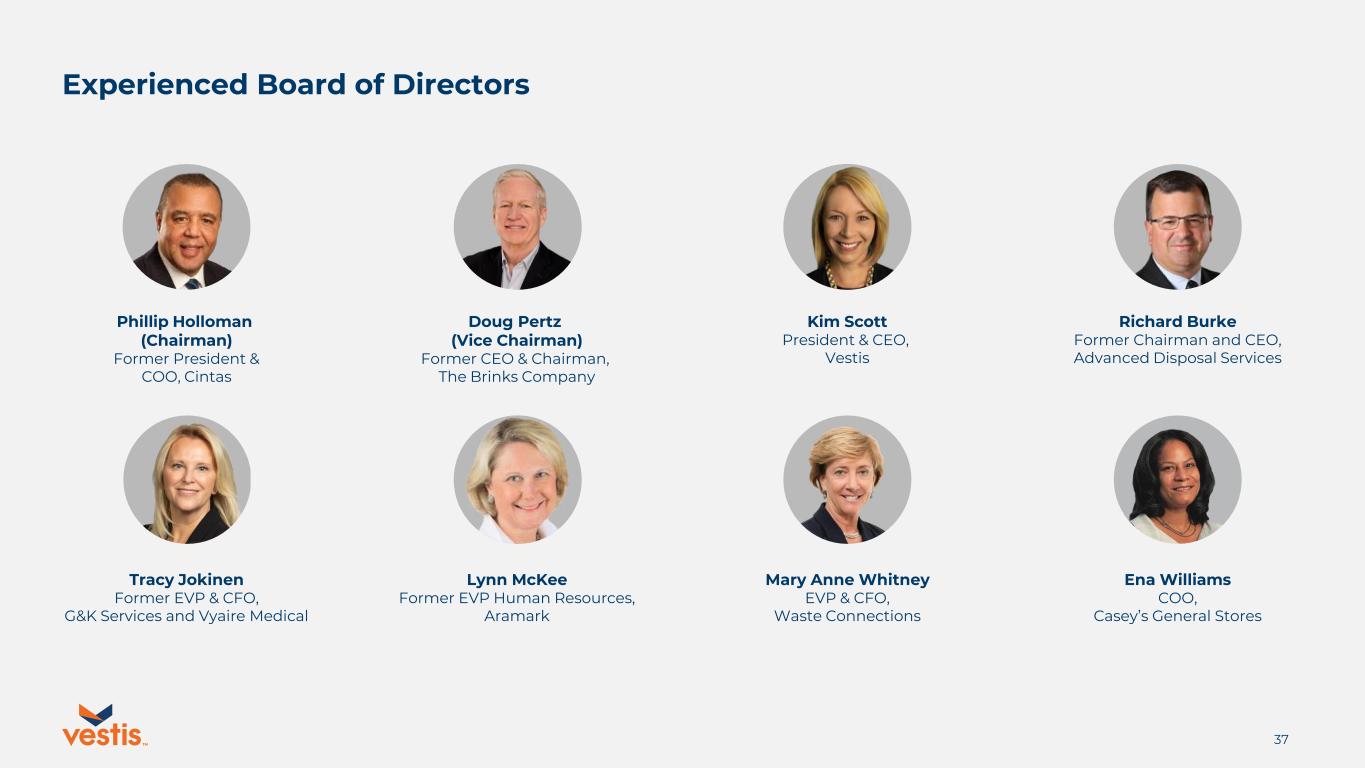
37TM Phillip Holloman (Chairman) Former President & COO, Cintas Doug Pertz (Vice Chairman) Former CEO & Chairman, The Brinks Company Kim Scott President & CEO, Vestis Richard Burke Former Chairman and CEO, Advanced Disposal Services Tracy Jokinen Former EVP & CFO, G&K Services and Vyaire Medical Lynn McKee Former EVP Human Resources, Aramark Mary Anne Whitney EVP & CFO, Waste Connections Ena Williams COO, Casey’s General Stores Experienced Board of Directors
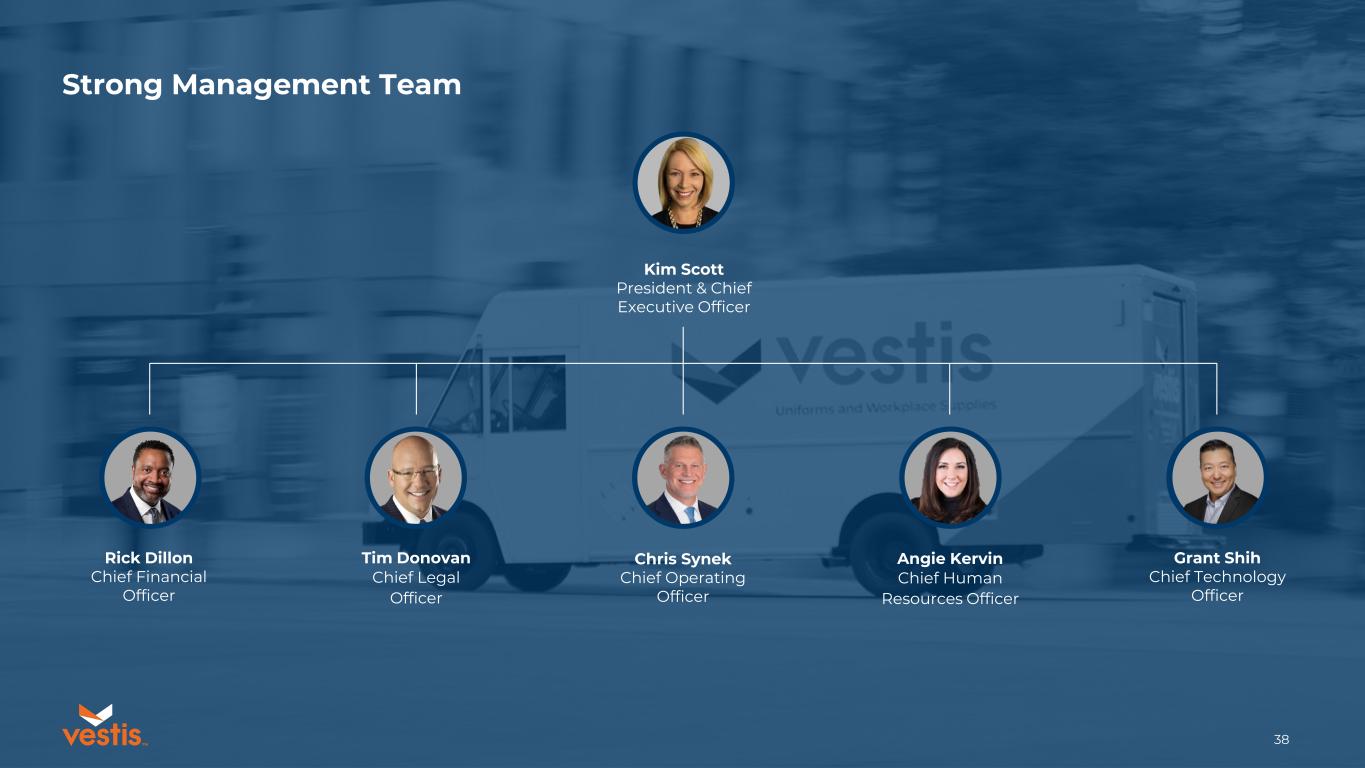
38TM Strong Management Team Kim Scott President & Chief Executive Officer Rick Dillon Chief Financial Officer Tim Donovan Chief Legal Officer Angie Kervin Chief Human Resources Officer Grant Shih Chief Technology Officer Chris Synek Chief Operating Officer
39TM Rick Dillon Chief Financial Officer Financial Overview
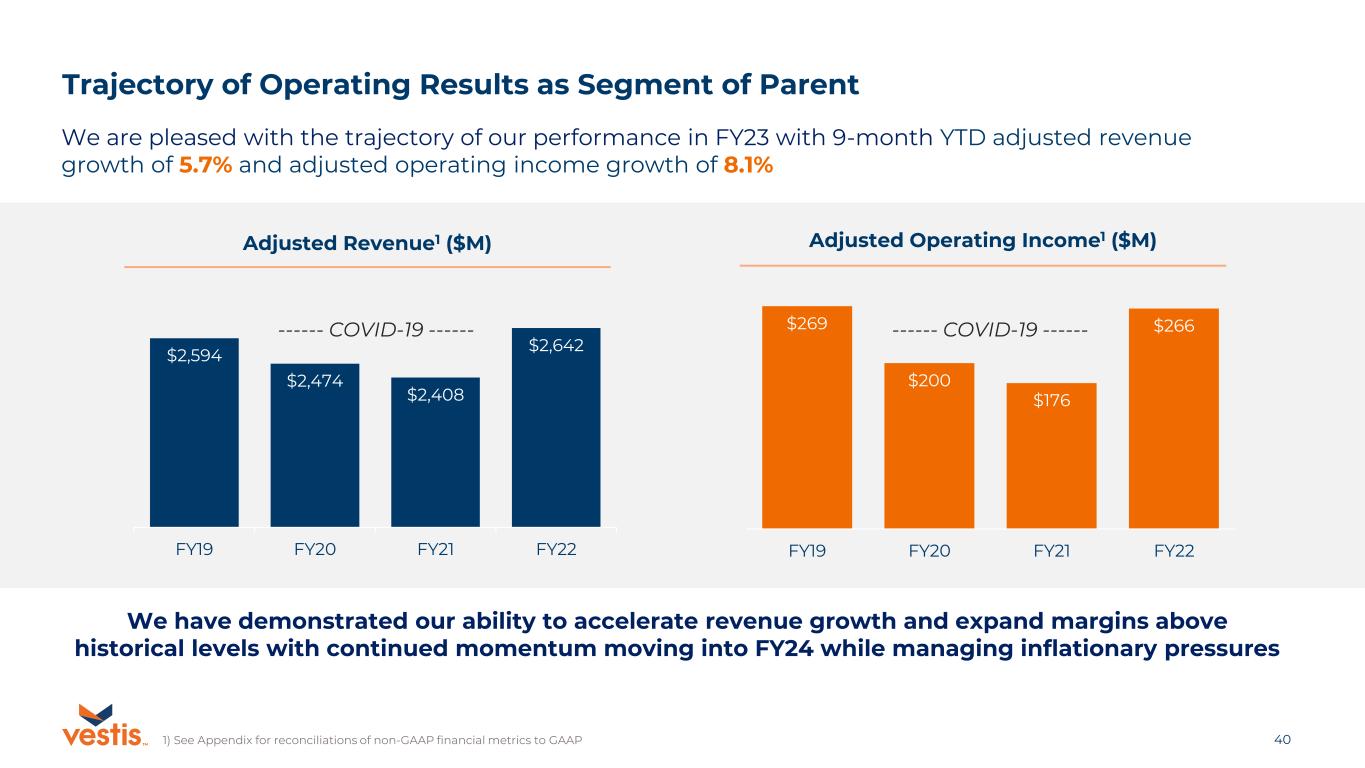
40TM Trajectory of Operating Results as Segment of Parent We are pleased with the trajectory of our performance in FY23 with 9-month YTD adjusted revenue growth of 5.7% and adjusted operating income growth of 8.1% $2,594 $2,474 $2,408 $2,642 FY19 FY20 FY21 FY22 ------ COVID-19 ------ Adjusted Revenue1 ($M) $269 $200 $176 $266 FY19 FY20 FY21 FY22 Adjusted Operating Income1 ($M) ------ COVID-19 ------ 1) See Appendix for reconciliations of non-GAAP financial metrics to GAAP We have demonstrated our ability to accelerate revenue growth and expand margins above historical levels with continued momentum moving into FY24 while managing inflationary pressures
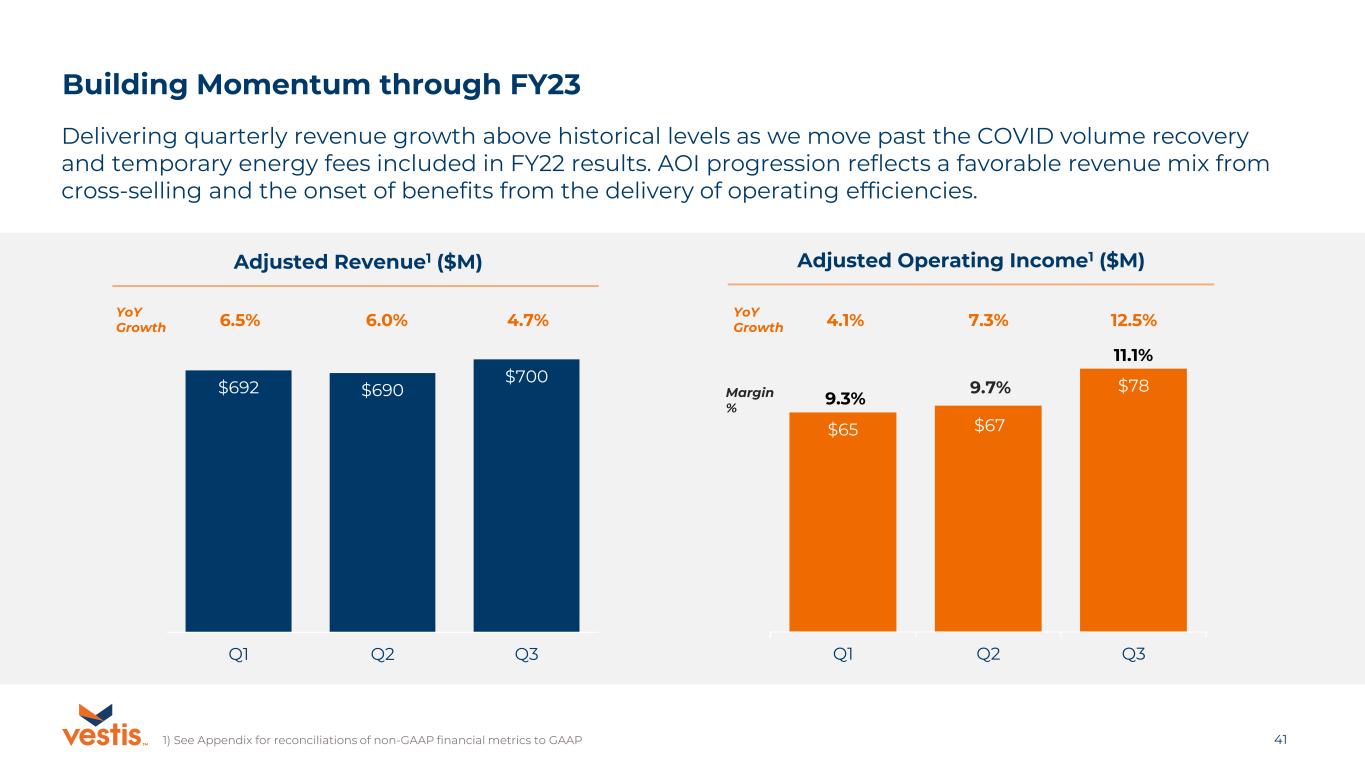
41TM Building Momentum through FY23 Delivering quarterly revenue growth above historical levels as we move past the COVID volume recovery and temporary energy fees included in FY22 results. AOI progression reflects a favorable revenue mix from cross-selling and the onset of benefits from the delivery of operating efficiencies. Adjusted Revenue1 ($M) Adjusted Operating Income1 ($M) $65 $67 $78 Q1 Q2 Q3 11.1% 9.3% $692 $690 $700 Q1 Q2 Q3 YoY Growth Margin % 4.7%6.0%6.5% 4.1% 7.3% 12.5% 9.7% 1) See Appendix for reconciliations of non-GAAP financial metrics to GAAP YoY Growth
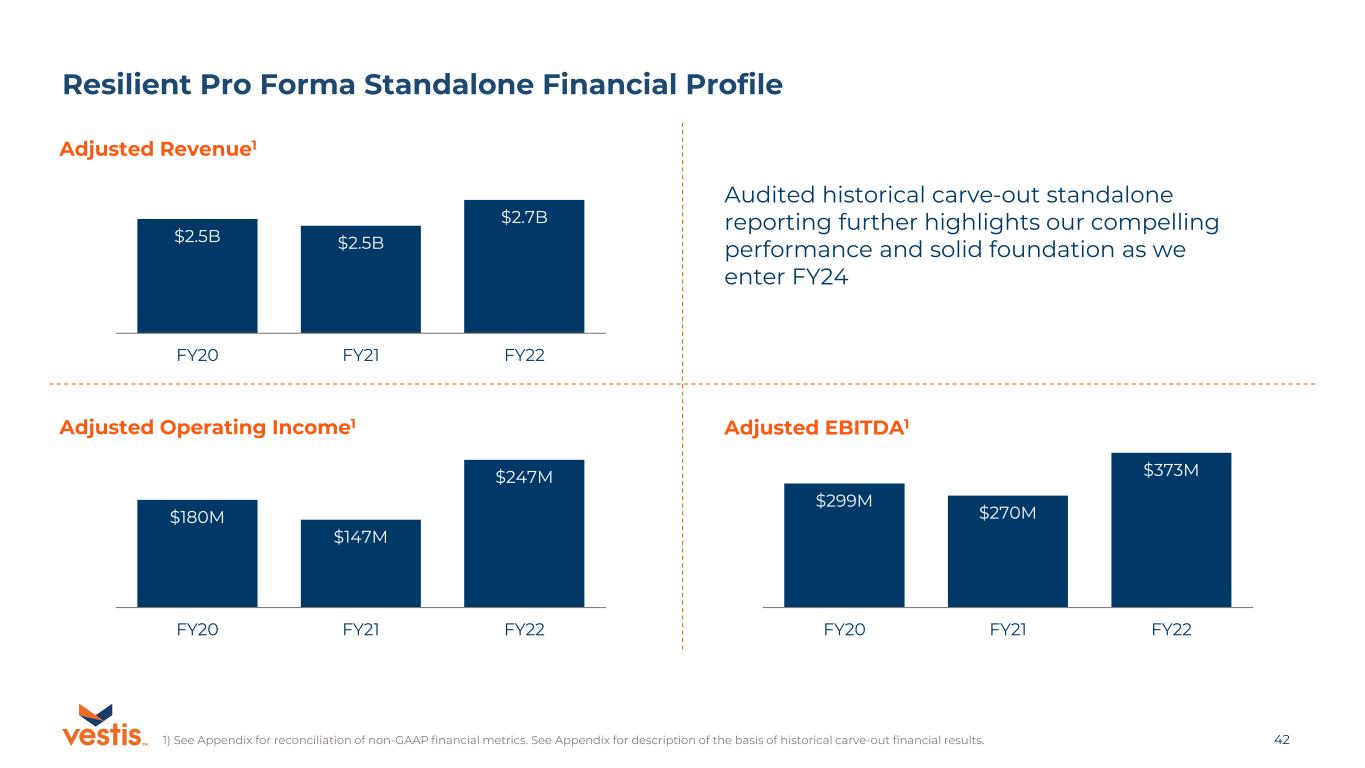
42TM $180M $147M $247M FY20 FY21 FY22 Resilient Pro Forma Standalone Financial Profile Adjusted Revenue1 Adjusted Operating Income1 Adjusted EBITDA1 Audited historical carve-out standalone reporting further highlights our compelling performance and solid foundation as we enter FY24 $2.5B $2.5B $2.7B FY20 FY21 FY22 $299M $270M $373M FY20 FY21 FY22 1) See Appendix for reconciliation of non-GAAP financial metrics. See Appendix for description of the basis of historical carve-out financial results.
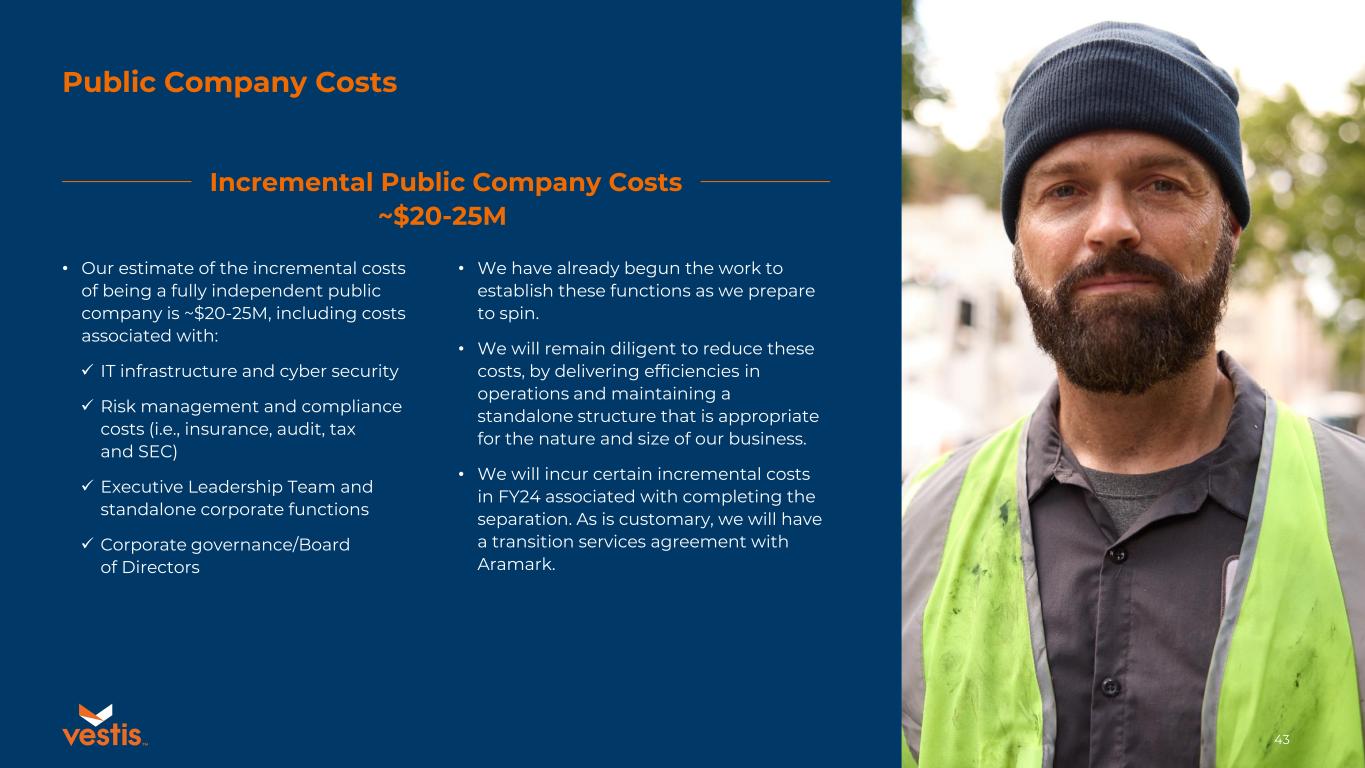
TM 43 Public Company Costs • Our estimate of the incremental costs of being a fully independent public company is ~$20-25M, including costs associated with: ✓ IT infrastructure and cyber security ✓ Risk management and compliance costs (i.e., insurance, audit, tax and SEC) ✓ Executive Leadership Team and standalone corporate functions ✓ Corporate governance/Board of Directors • We have already begun the work to establish these functions as we prepare to spin. • We will remain diligent to reduce these costs, by delivering efficiencies in operations and maintaining a standalone structure that is appropriate for the nature and size of our business. • We will incur certain incremental costs in FY24 associated with completing the separation. As is customary, we will have a transition services agreement with Aramark. Incremental Public Company Costs ~$20-25M
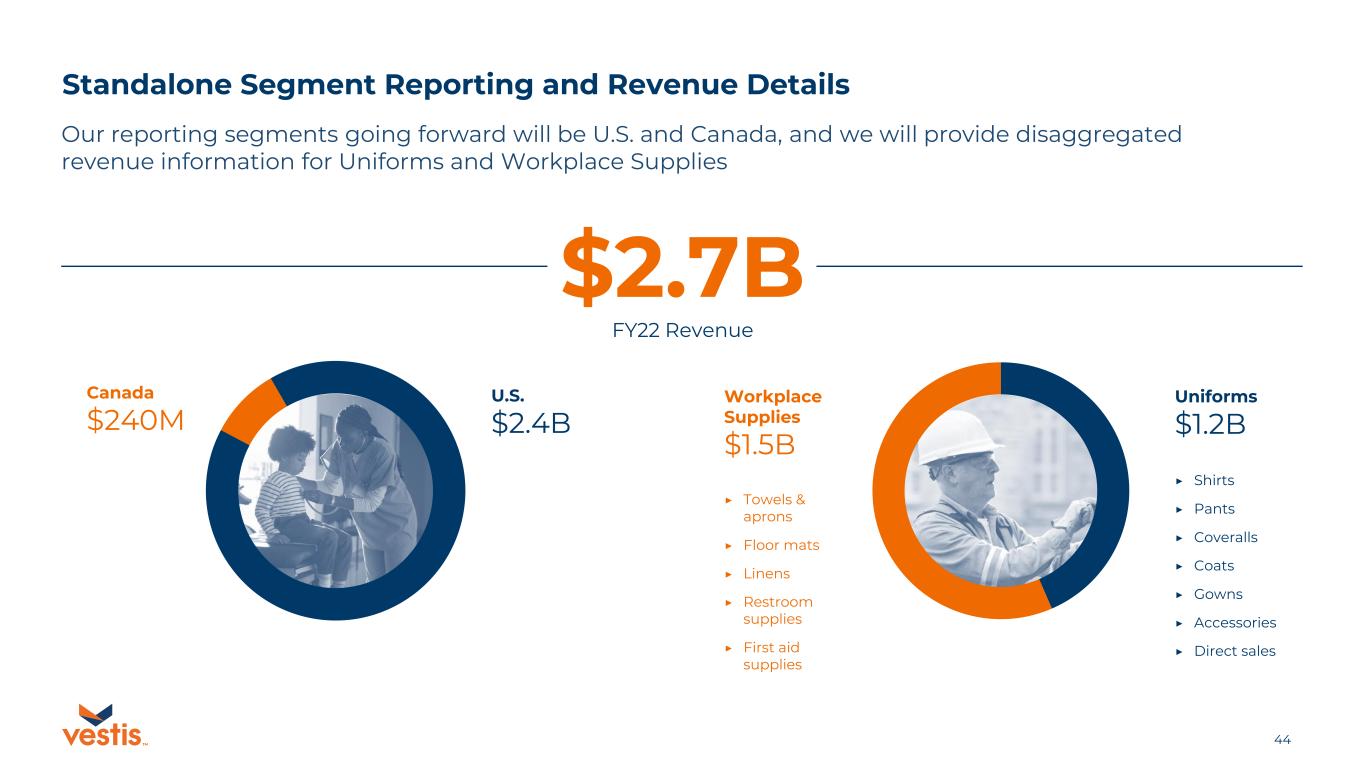
44TM Standalone Segment Reporting and Revenue Details Our reporting segments going forward will be U.S. and Canada, and we will provide disaggregated revenue information for Uniforms and Workplace Supplies $2.7B FY22 Revenue Canada $240M U.S. $2.4B Workplace Supplies $1.5B Uniforms $1.2B ▶ Shirts ▶ Pants ▶ Coveralls ▶ Coats ▶ Gowns ▶ Accessories ▶ Direct sales ▶ Towels & aprons ▶ Floor mats ▶ Linens ▶ Restroom supplies ▶ First aid supplies
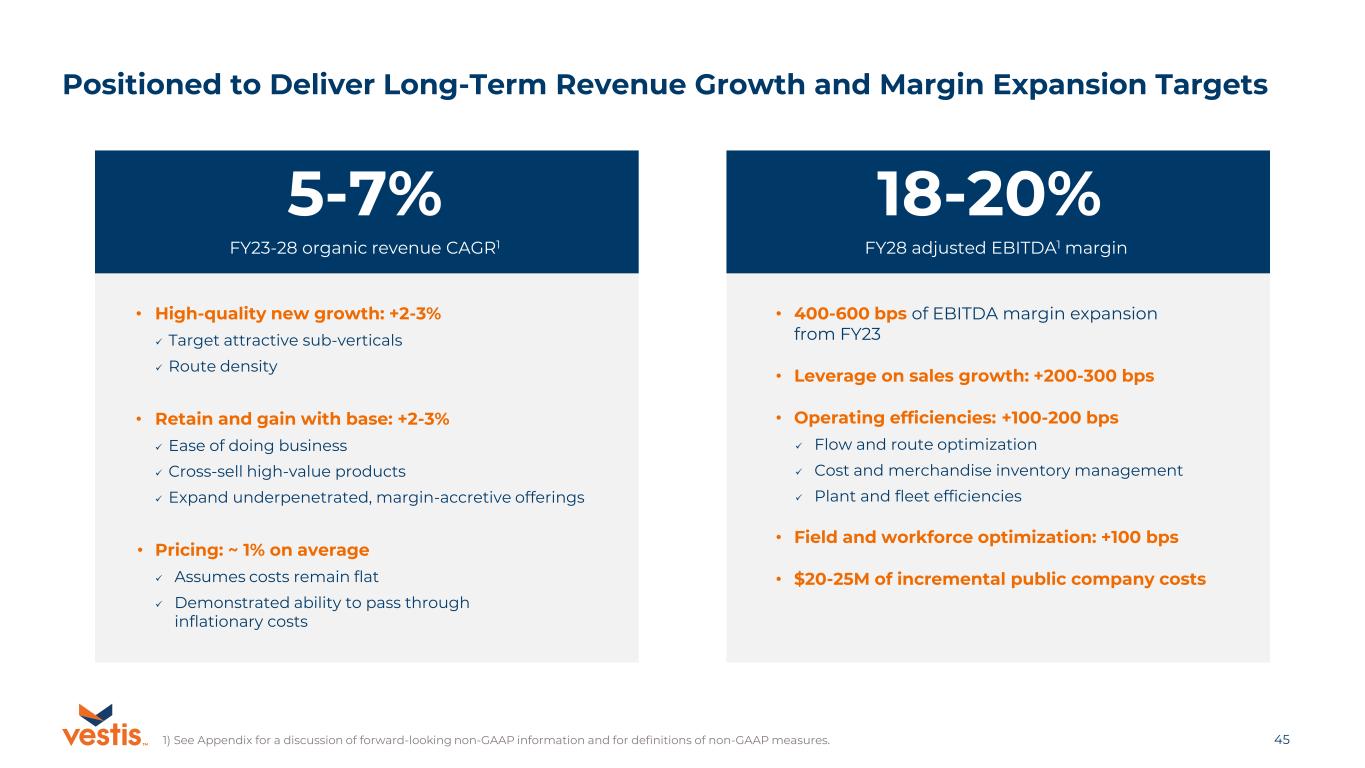
45TM Positioned to Deliver Long-Term Revenue Growth and Margin Expansion Targets FY23-28 organic revenue CAGR1 5-7% • High-quality new growth: +2-3% ✓ Target attractive sub-verticals ✓ Route density • Retain and gain with base: +2-3% ✓ Ease of doing business ✓ Cross-sell high-value products ✓ Expand underpenetrated, margin-accretive offerings • Pricing: ~ 1% on average ✓ Assumes costs remain flat ✓ Demonstrated ability to pass through inflationary costs FY28 adjusted EBITDA1 margin 18-20% • 400-600 bps of EBITDA margin expansion from FY23 • Leverage on sales growth: +200-300 bps • Operating efficiencies: +100-200 bps ✓ Flow and route optimization ✓ Cost and merchandise inventory management ✓ Plant and fleet efficiencies • Field and workforce optimization: +100 bps • $20-25M of incremental public company costs 1) See Appendix for a discussion of forward-looking non-GAAP information and for definitions of non-GAAP measures.
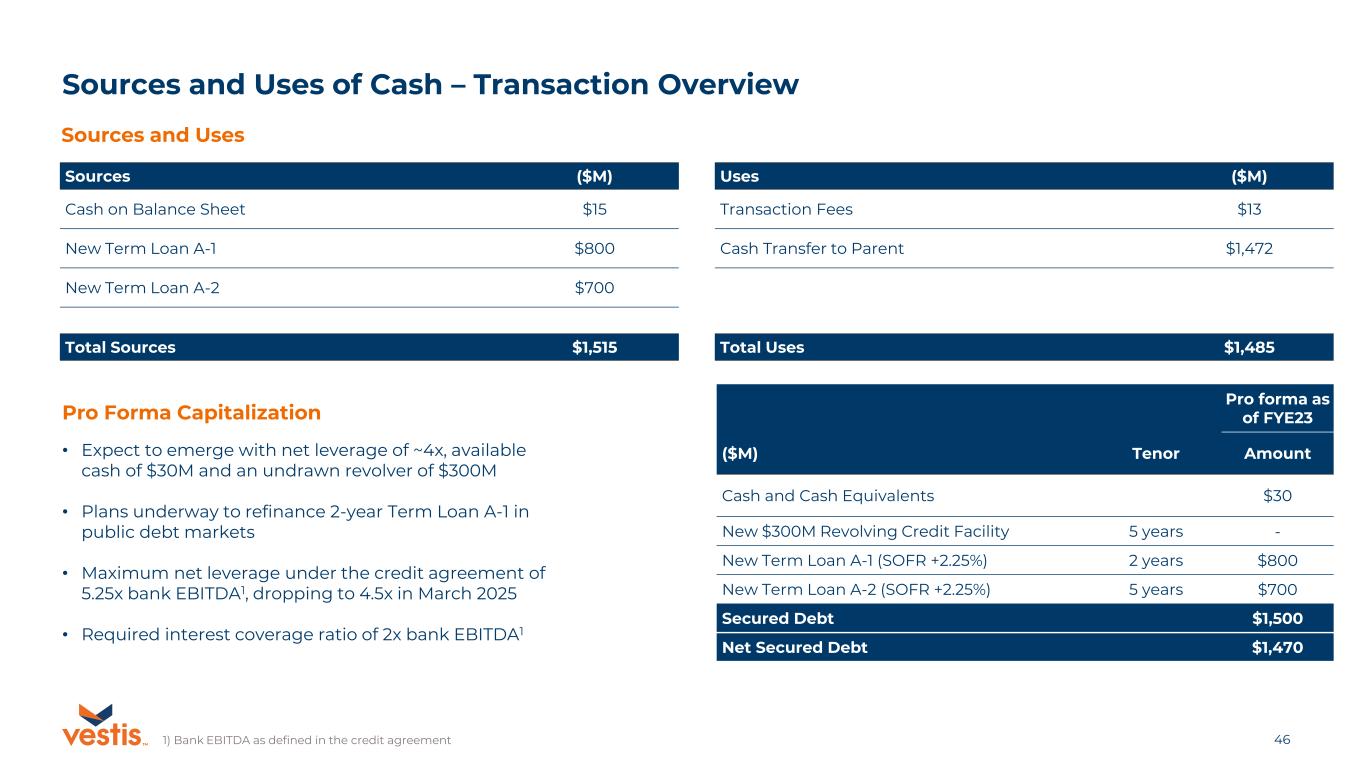
46TM Sources and Uses of Cash – Transaction Overview Sources ($M) Uses ($M) Cash on Balance Sheet $15 Transaction Fees $13 New Term Loan A-1 $800 Cash Transfer to Parent $1,472 New Term Loan A-2 $700 Total Sources $1,515 Total Uses $1,485 Sources and Uses Pro forma as of FYE23 ($M) Tenor Amount Cash and Cash Equivalents $30 New $300M Revolving Credit Facility 5 years - New Term Loan A-1 (SOFR +2.25%) 2 years $800 New Term Loan A-2 (SOFR +2.25%) 5 years $700 Secured Debt $1,500 Net Secured Debt $1,470 Pro Forma Capitalization • Expect to emerge with net leverage of ~4x, available cash of $30M and an undrawn revolver of $300M • Plans underway to refinance 2-year Term Loan A-1 in public debt markets • Maximum net leverage under the credit agreement of 5.25x bank EBITDA1, dropping to 4.5x in March 2025 • Required interest coverage ratio of 2x bank EBITDA1 1) Bank EBITDA as defined in the credit agreement
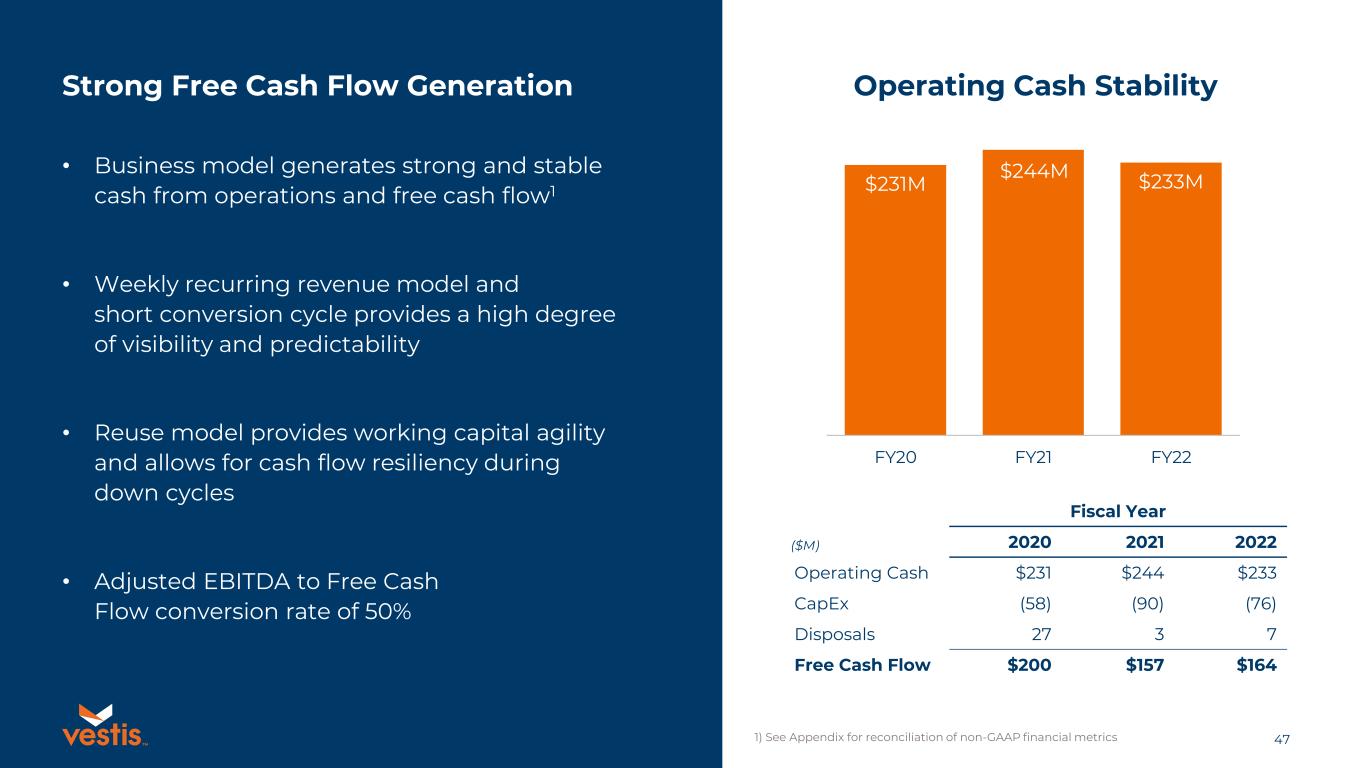
TM 47 $231M $244M $233M FY20 FY21 FY22 Strong Free Cash Flow Generation • Business model generates strong and stable cash from operations and free cash flow1 • Weekly recurring revenue model and short conversion cycle provides a high degree of visibility and predictability • Reuse model provides working capital agility and allows for cash flow resiliency during down cycles • Adjusted EBITDA to Free Cash Flow conversion rate of 50% Operating Cash Stability Fiscal Year 2020 2021 2022 Operating Cash $231 $244 $233 CapEx (58) (90) (76) Disposals 27 3 7 Free Cash Flow $200 $157 $164 ($M) 1) See Appendix for reconciliation of non-GAAP financial metrics
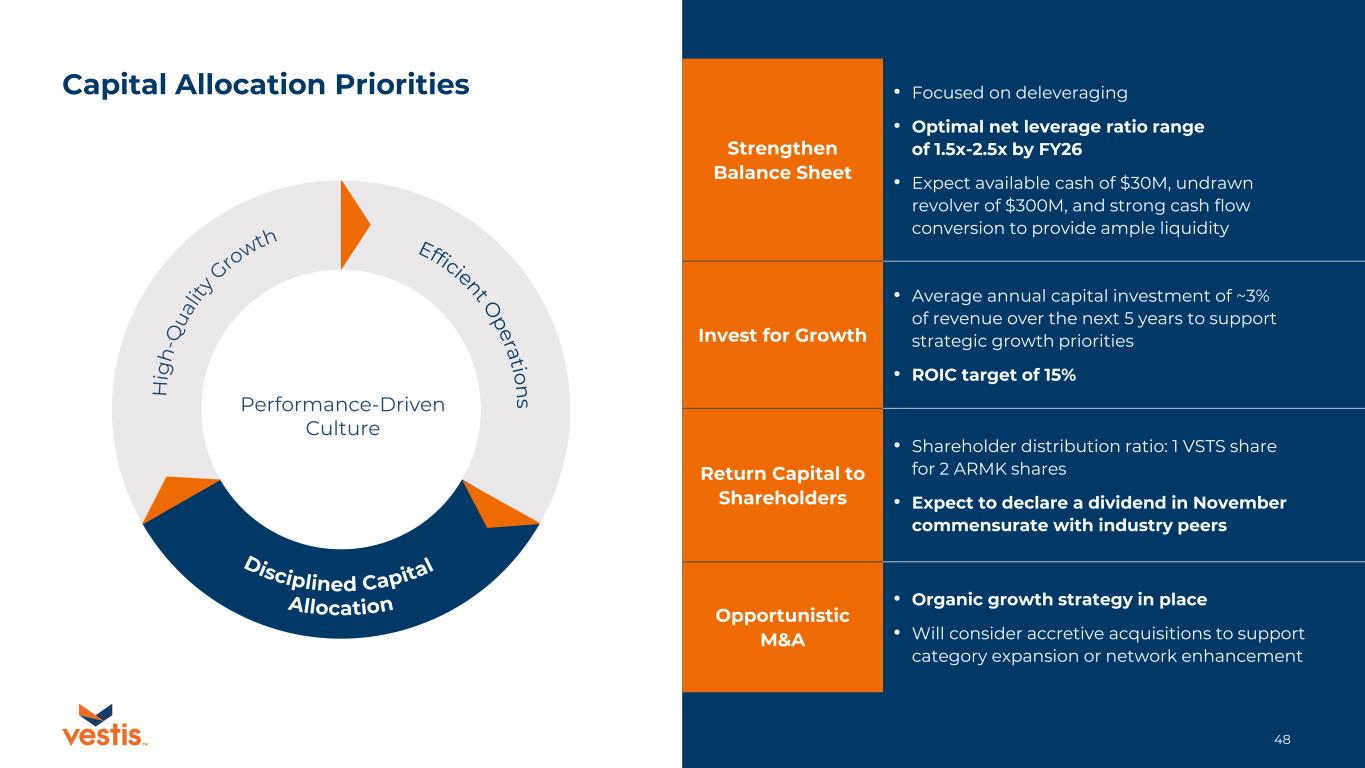
48TM Efficient O peration sH ig h -Q ua lit y Gro wth Disciplined Capital Allocation Capital Allocation Priorities Performance-Driven Culture Strengthen Balance Sheet • Focused on deleveraging • Optimal net leverage ratio range of 1.5x-2.5x by FY26 • Expect available cash of $30M, undrawn revolver of $300M, and strong cash flow conversion to provide ample liquidity Invest for Growth • Average annual capital investment of ~3% of revenue over the next 5 years to support strategic growth priorities • ROIC target of 15% Return Capital to Shareholders • Shareholder distribution ratio: 1 VSTS share for 2 ARMK shares • Expect to declare a dividend in November commensurate with industry peers Opportunistic M&A • Organic growth strategy in place • Will consider accretive acquisitions to support category expansion or network enhancement
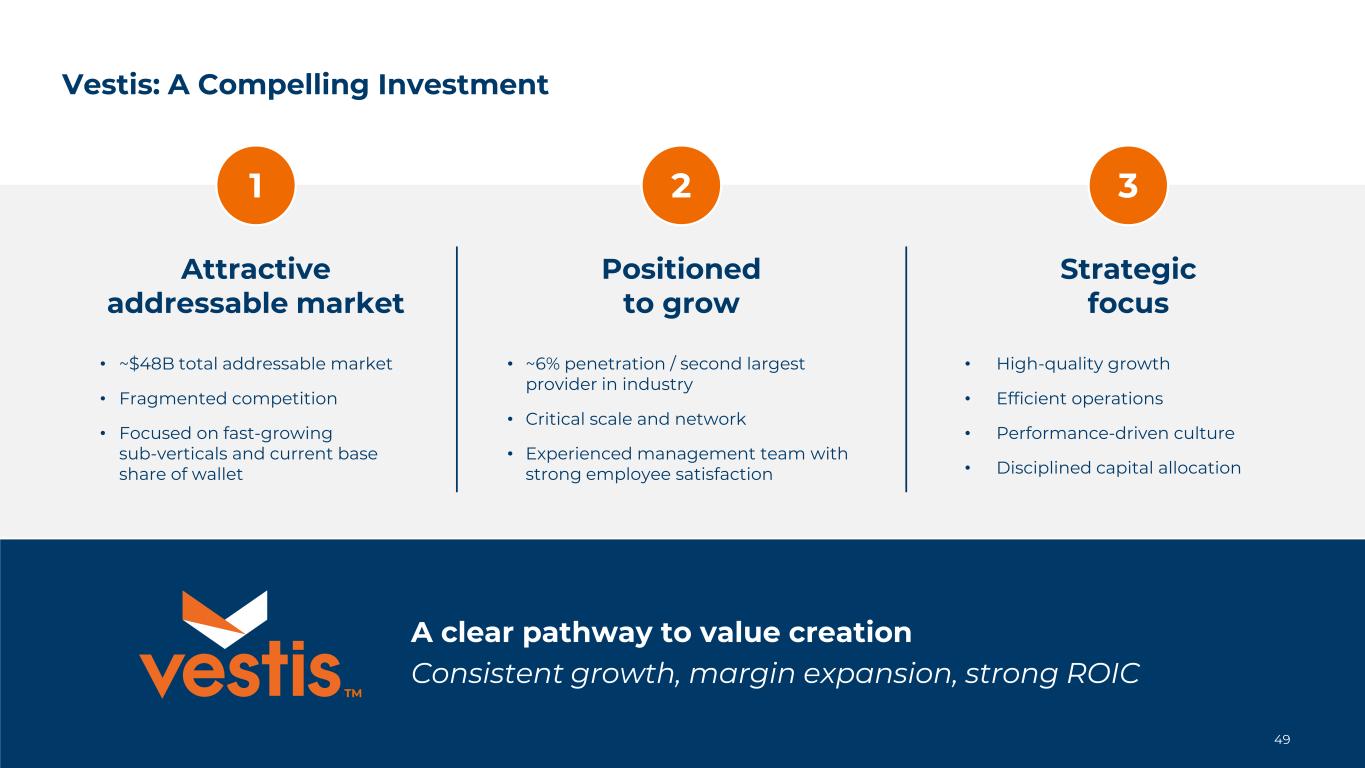
49TM Attractive addressable market Strategic focus • ~$48B total addressable market • Fragmented competition • Focused on fast-growing sub-verticals and current base share of wallet • High-quality growth • Efficient operations • Performance-driven culture • Disciplined capital allocation Vestis: A Compelling Investment 1 • ~6% penetration / second largest provider in industry • Critical scale and network • Experienced management team with strong employee satisfaction Positioned to grow 2 3 A clear pathway to value creation Consistent growth, margin expansion, strong ROIC TM
50TM APPENDIX
51TM Enable the executive leadership and boards of each standalone company to focus solely on its respective business Each business’ narrowed focus, and the ability to compensate employees with equity incentives linked solely to its own performance, enhances the ability to attract and retain strong employees Availability of equity linked solely to its distinct business will facilitate each company’s acquisition strategies Flexibility for optimizing capital structures and capital deployment priorities Ability for the investment community to value each business independently, which the Company expects will result in optimized total stockholder returns Separation Rationale Create two industry-leading, independent, publicly-traded companies with distinct growth and profitability strategies, business characteristics and investment profiles
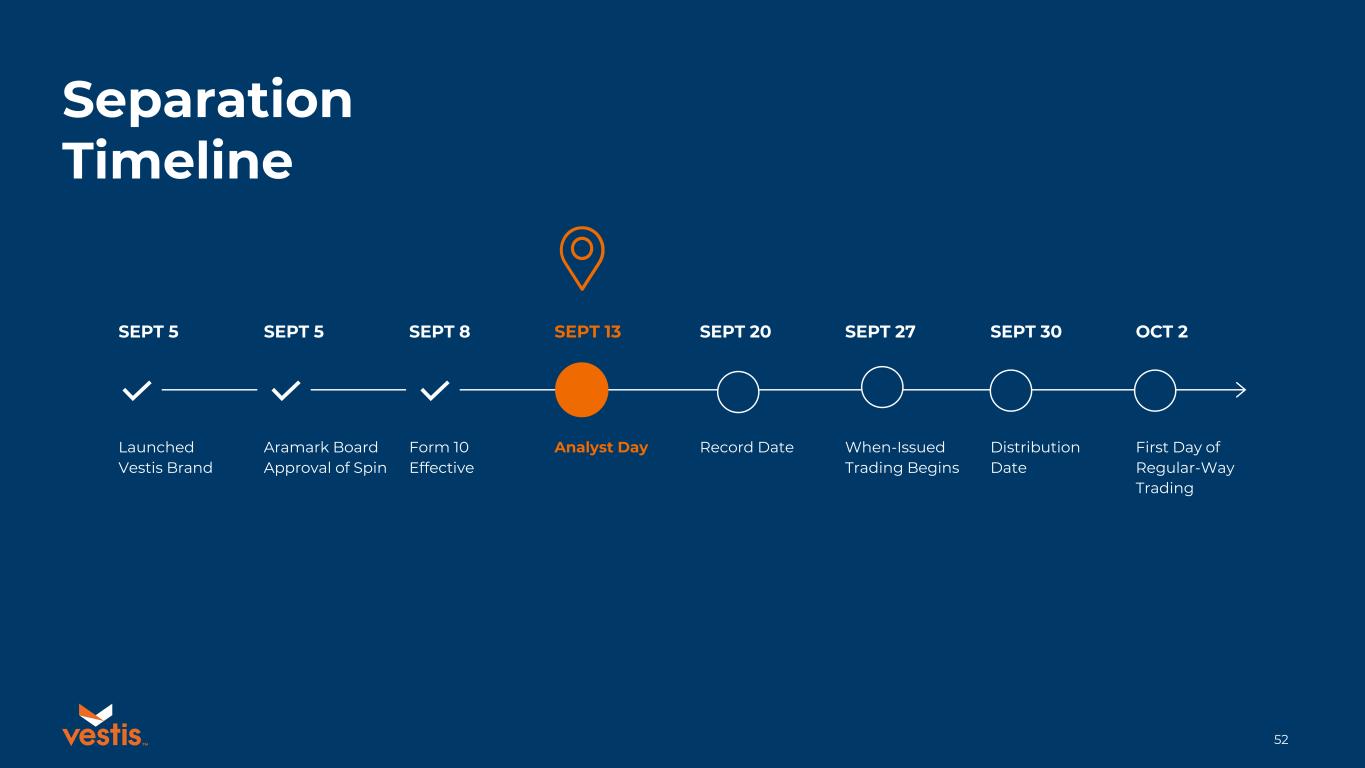
52TM SEPT 5 SEPT 5 SEPT 8 SEPT 13 SEPT 20 SEPT 27 SEPT 30 OCT 2 Separation Timeline Launched Vestis Brand Aramark Board Approval of Spin Form 10 Effective Analyst Day Record Date When-Issued Trading Begins Distribution Date First Day of Regular-Way Trading
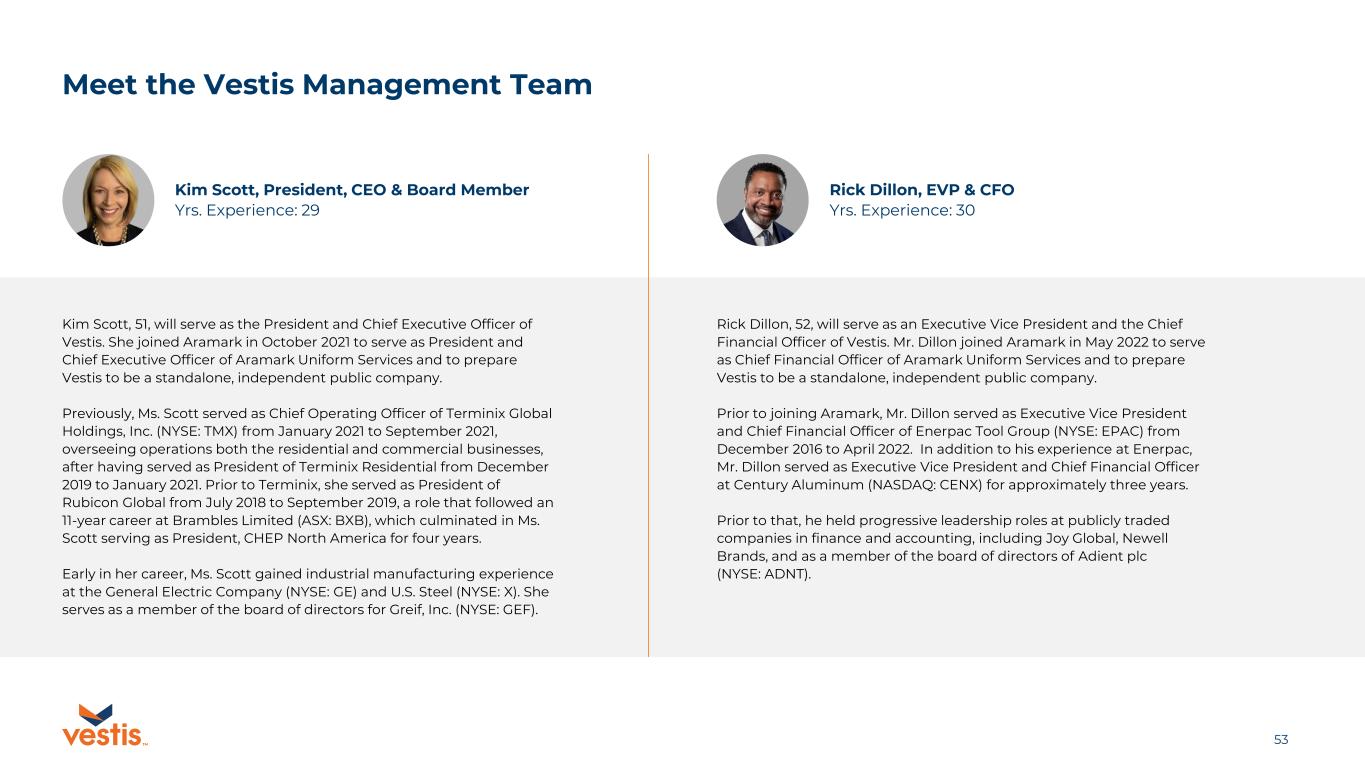
53TM Kim Scott, 51, will serve as the President and Chief Executive Officer of Vestis. She joined Aramark in October 2021 to serve as President and Chief Executive Officer of Aramark Uniform Services and to prepare Vestis to be a standalone, independent public company. Previously, Ms. Scott served as Chief Operating Officer of Terminix Global Holdings, Inc. (NYSE: TMX) from January 2021 to September 2021, overseeing operations both the residential and commercial businesses, after having served as President of Terminix Residential from December 2019 to January 2021. Prior to Terminix, she served as President of Rubicon Global from July 2018 to September 2019, a role that followed an 11-year career at Brambles Limited (ASX: BXB), which culminated in Ms. Scott serving as President, CHEP North America for four years. Early in her career, Ms. Scott gained industrial manufacturing experience at the General Electric Company (NYSE: GE) and U.S. Steel (NYSE: X). She serves as a member of the board of directors for Greif, Inc. (NYSE: GEF). Rick Dillon, 52, will serve as an Executive Vice President and the Chief Financial Officer of Vestis. Mr. Dillon joined Aramark in May 2022 to serve as Chief Financial Officer of Aramark Uniform Services and to prepare Vestis to be a standalone, independent public company. Prior to joining Aramark, Mr. Dillon served as Executive Vice President and Chief Financial Officer of Enerpac Tool Group (NYSE: EPAC) from December 2016 to April 2022. In addition to his experience at Enerpac, Mr. Dillon served as Executive Vice President and Chief Financial Officer at Century Aluminum (NASDAQ: CENX) for approximately three years. Prior to that, he held progressive leadership roles at publicly traded companies in finance and accounting, including Joy Global, Newell Brands, and as a member of the board of directors of Adient plc (NYSE: ADNT). Rick Dillon, EVP & CFO Yrs. Experience: 30 Kim Scott, President, CEO & Board Member Yrs. Experience: 29 Meet the Vestis Management Team
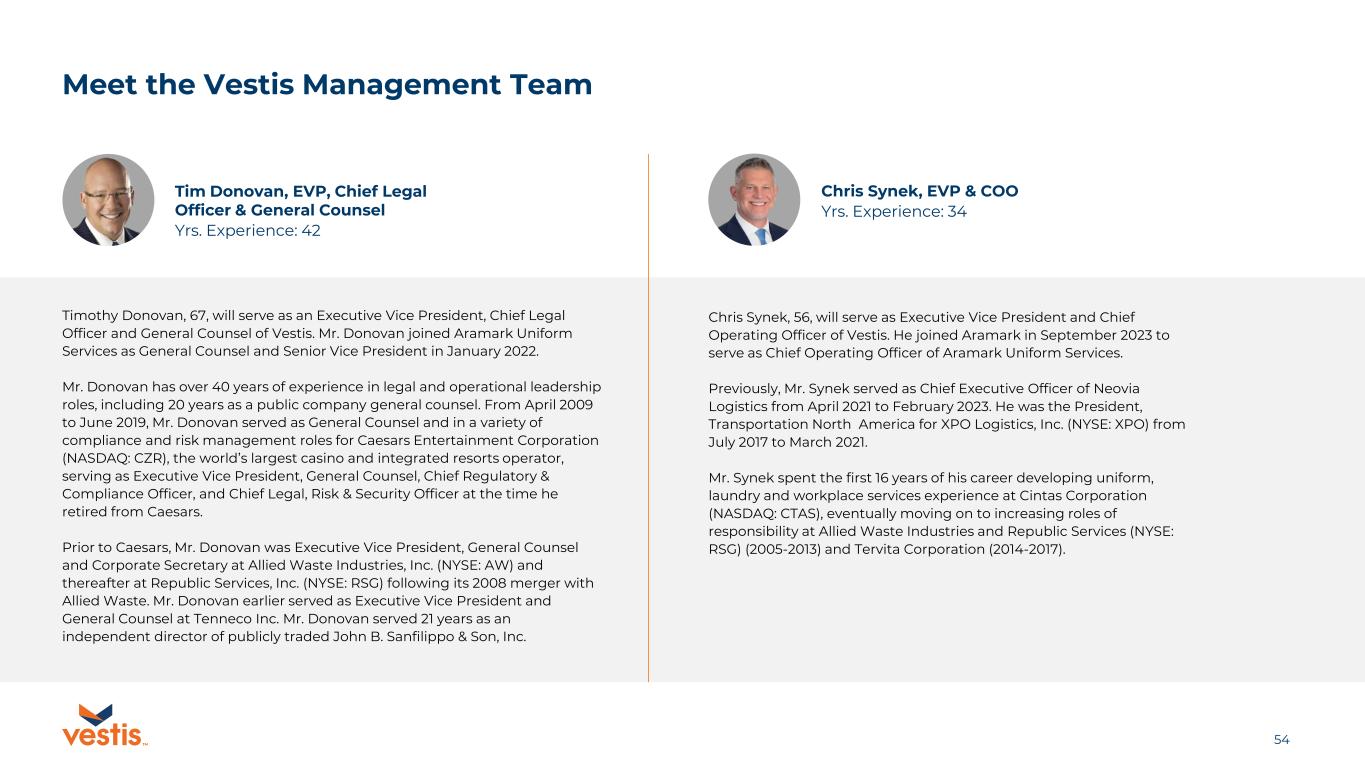
54TM Timothy Donovan, 67, will serve as an Executive Vice President, Chief Legal Officer and General Counsel of Vestis. Mr. Donovan joined Aramark Uniform Services as General Counsel and Senior Vice President in January 2022. Mr. Donovan has over 40 years of experience in legal and operational leadership roles, including 20 years as a public company general counsel. From April 2009 to June 2019, Mr. Donovan served as General Counsel and in a variety of compliance and risk management roles for Caesars Entertainment Corporation (NASDAQ: CZR), the world’s largest casino and integrated resorts operator, serving as Executive Vice President, General Counsel, Chief Regulatory & Compliance Officer, and Chief Legal, Risk & Security Officer at the time he retired from Caesars. Prior to Caesars, Mr. Donovan was Executive Vice President, General Counsel and Corporate Secretary at Allied Waste Industries, Inc. (NYSE: AW) and thereafter at Republic Services, Inc. (NYSE: RSG) following its 2008 merger with Allied Waste. Mr. Donovan earlier served as Executive Vice President and General Counsel at Tenneco Inc. Mr. Donovan served 21 years as an independent director of publicly traded John B. Sanfilippo & Son, Inc. Tim Donovan, EVP, Chief Legal Officer & General Counsel Yrs. Experience: 42 Meet the Vestis Management Team Chris Synek, 56, will serve as Executive Vice President and Chief Operating Officer of Vestis. He joined Aramark in September 2023 to serve as Chief Operating Officer of Aramark Uniform Services. Previously, Mr. Synek served as Chief Executive Officer of Neovia Logistics from April 2021 to February 2023. He was the President, Transportation North America for XPO Logistics, Inc. (NYSE: XPO) from July 2017 to March 2021. Mr. Synek spent the first 16 years of his career developing uniform, laundry and workplace services experience at Cintas Corporation (NASDAQ: CTAS), eventually moving on to increasing roles of responsibility at Allied Waste Industries and Republic Services (NYSE: RSG) (2005-2013) and Tervita Corporation (2014-2017). Chris Synek, EVP & COO Yrs. Experience: 34
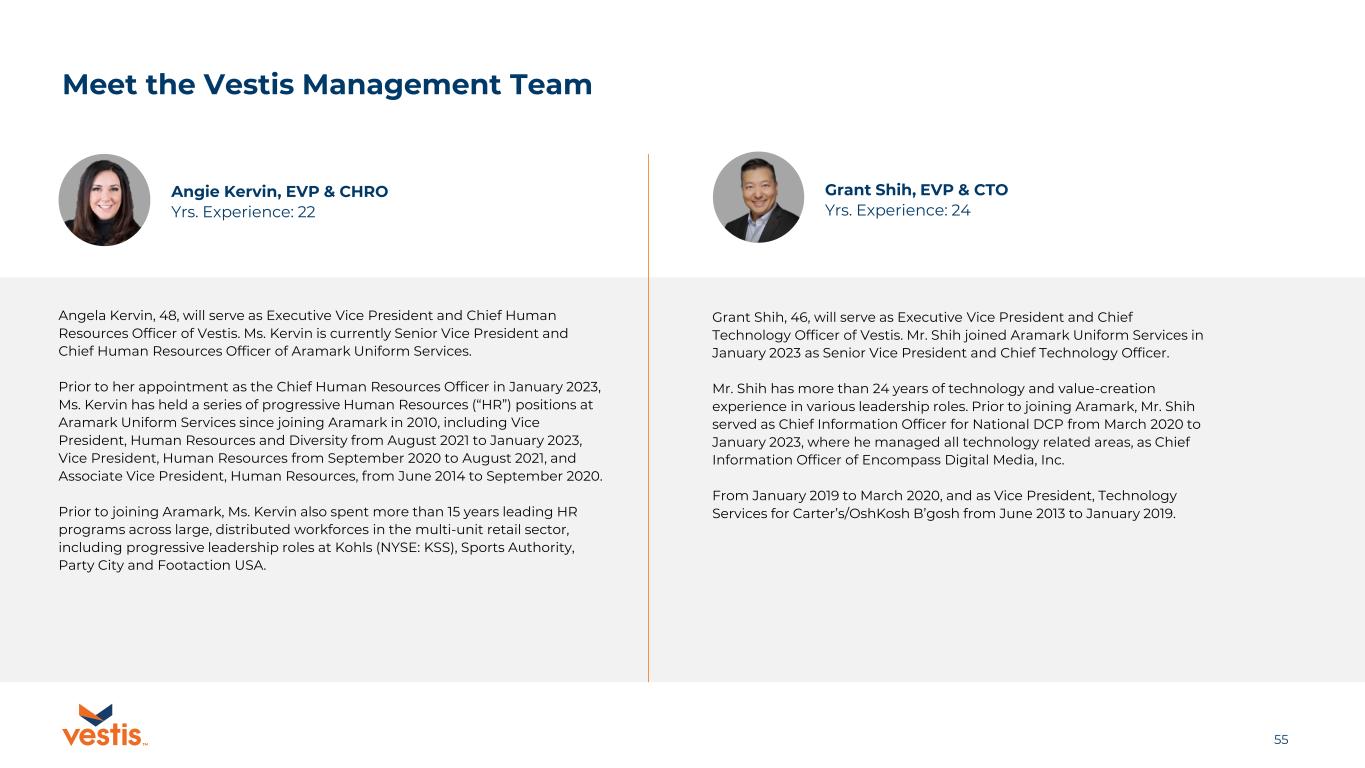
55TM Meet the Vestis Management Team Angela Kervin, 48, will serve as Executive Vice President and Chief Human Resources Officer of Vestis. Ms. Kervin is currently Senior Vice President and Chief Human Resources Officer of Aramark Uniform Services. Prior to her appointment as the Chief Human Resources Officer in January 2023, Ms. Kervin has held a series of progressive Human Resources (“HR”) positions at Aramark Uniform Services since joining Aramark in 2010, including Vice President, Human Resources and Diversity from August 2021 to January 2023, Vice President, Human Resources from September 2020 to August 2021, and Associate Vice President, Human Resources, from June 2014 to September 2020. Prior to joining Aramark, Ms. Kervin also spent more than 15 years leading HR programs across large, distributed workforces in the multi-unit retail sector, including progressive leadership roles at Kohls (NYSE: KSS), Sports Authority, Party City and Footaction USA. Angie Kervin, EVP & CHRO Yrs. Experience: 22 Grant Shih, 46, will serve as Executive Vice President and Chief Technology Officer of Vestis. Mr. Shih joined Aramark Uniform Services in January 2023 as Senior Vice President and Chief Technology Officer. Mr. Shih has more than 24 years of technology and value-creation experience in various leadership roles. Prior to joining Aramark, Mr. Shih served as Chief Information Officer for National DCP from March 2020 to January 2023, where he managed all technology related areas, as Chief Information Officer of Encompass Digital Media, Inc. From January 2019 to March 2020, and as Vice President, Technology Services for Carter’s/OshKosh B’gosh from June 2013 to January 2019. Grant Shih, EVP & CTO Yrs. Experience: 24
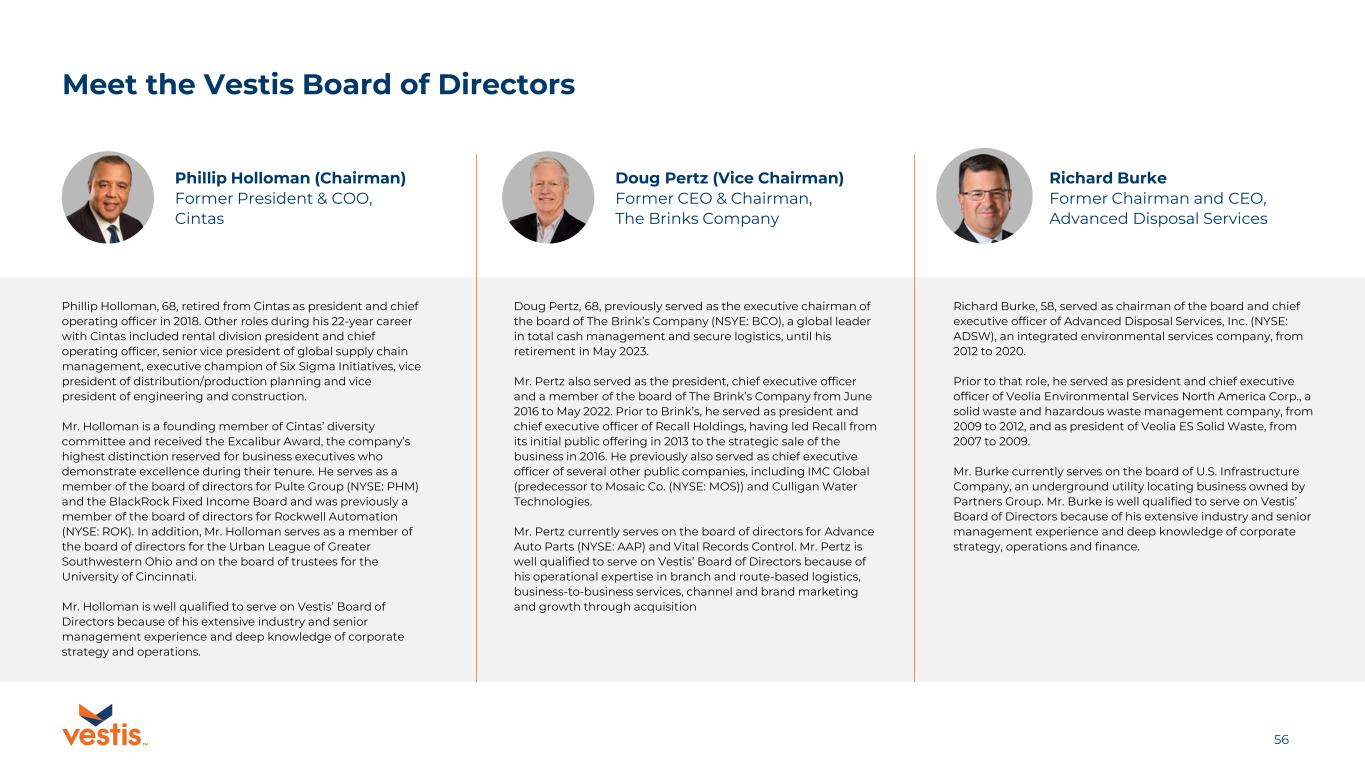
56TM Phillip Holloman, 68, retired from Cintas as president and chief operating officer in 2018. Other roles during his 22-year career with Cintas included rental division president and chief operating officer, senior vice president of global supply chain management, executive champion of Six Sigma Initiatives, vice president of distribution/production planning and vice president of engineering and construction. Mr. Holloman is a founding member of Cintas’ diversity committee and received the Excalibur Award, the company’s highest distinction reserved for business executives who demonstrate excellence during their tenure. He serves as a member of the board of directors for Pulte Group (NYSE: PHM) and the BlackRock Fixed Income Board and was previously a member of the board of directors for Rockwell Automation (NYSE: ROK). In addition, Mr. Holloman serves as a member of the board of directors for the Urban League of Greater Southwestern Ohio and on the board of trustees for the University of Cincinnati. Mr. Holloman is well qualified to serve on Vestis’ Board of Directors because of his extensive industry and senior management experience and deep knowledge of corporate strategy and operations. Phillip Holloman (Chairman) Former President & COO, Cintas Meet the Vestis Board of Directors Doug Pertz, 68, previously served as the executive chairman of the board of The Brink’s Company (NSYE: BCO), a global leader in total cash management and secure logistics, until his retirement in May 2023. Mr. Pertz also served as the president, chief executive officer and a member of the board of The Brink’s Company from June 2016 to May 2022. Prior to Brink’s, he served as president and chief executive officer of Recall Holdings, having led Recall from its initial public offering in 2013 to the strategic sale of the business in 2016. He previously also served as chief executive officer of several other public companies, including IMC Global (predecessor to Mosaic Co. (NYSE: MOS)) and Culligan Water Technologies. Mr. Pertz currently serves on the board of directors for Advance Auto Parts (NYSE: AAP) and Vital Records Control. Mr. Pertz is well qualified to serve on Vestis’ Board of Directors because of his operational expertise in branch and route-based logistics, business-to-business services, channel and brand marketing and growth through acquisition Doug Pertz (Vice Chairman) Former CEO & Chairman, The Brinks Company Richard Burke, 58, served as chairman of the board and chief executive officer of Advanced Disposal Services, Inc. (NYSE: ADSW), an integrated environmental services company, from 2012 to 2020. Prior to that role, he served as president and chief executive officer of Veolia Environmental Services North America Corp., a solid waste and hazardous waste management company, from 2009 to 2012, and as president of Veolia ES Solid Waste, from 2007 to 2009. Mr. Burke currently serves on the board of U.S. Infrastructure Company, an underground utility locating business owned by Partners Group. Mr. Burke is well qualified to serve on Vestis’ Board of Directors because of his extensive industry and senior management experience and deep knowledge of corporate strategy, operations and finance. Richard Burke Former Chairman and CEO, Advanced Disposal Services
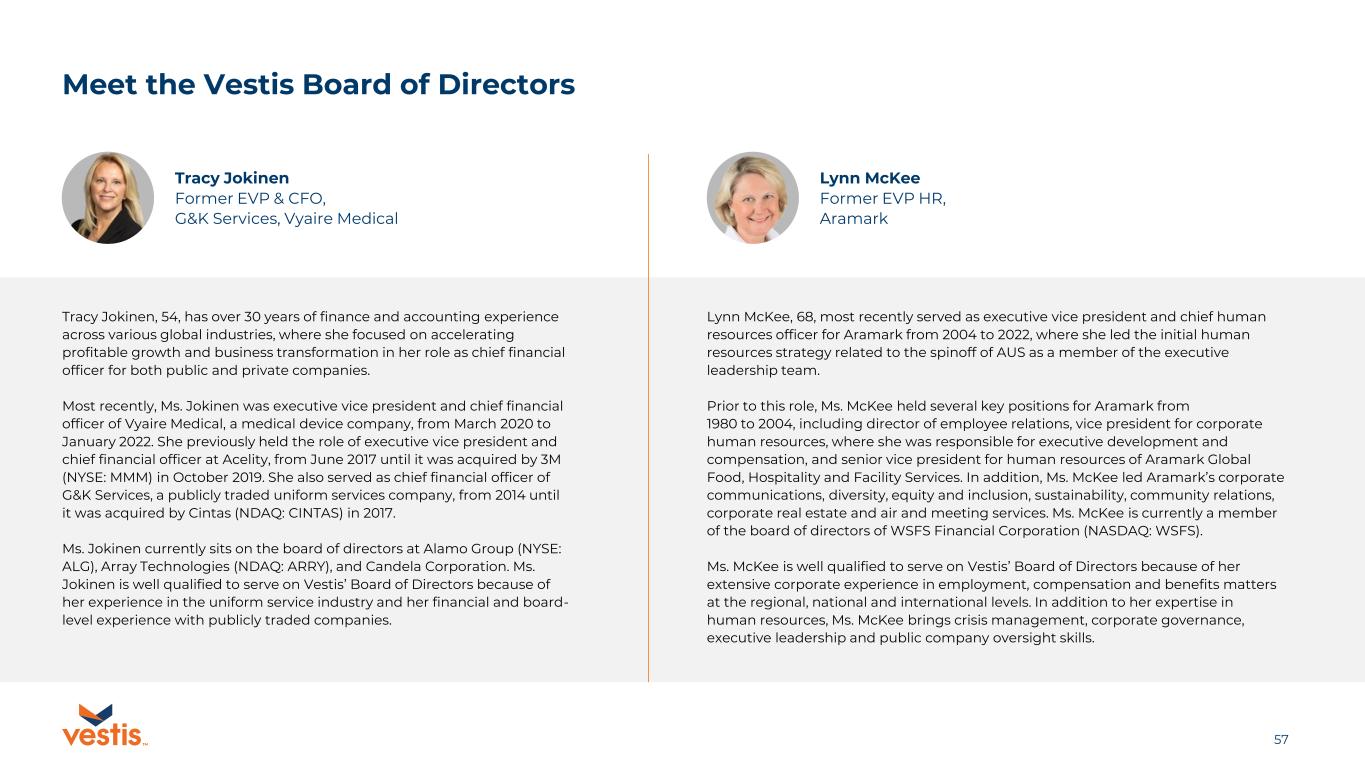
57TM Tracy Jokinen, 54, has over 30 years of finance and accounting experience across various global industries, where she focused on accelerating profitable growth and business transformation in her role as chief financial officer for both public and private companies. Most recently, Ms. Jokinen was executive vice president and chief financial officer of Vyaire Medical, a medical device company, from March 2020 to January 2022. She previously held the role of executive vice president and chief financial officer at Acelity, from June 2017 until it was acquired by 3M (NYSE: MMM) in October 2019. She also served as chief financial officer of G&K Services, a publicly traded uniform services company, from 2014 until it was acquired by Cintas (NDAQ: CINTAS) in 2017. Ms. Jokinen currently sits on the board of directors at Alamo Group (NYSE: ALG), Array Technologies (NDAQ: ARRY), and Candela Corporation. Ms. Jokinen is well qualified to serve on Vestis’ Board of Directors because of her experience in the uniform service industry and her financial and board- level experience with publicly traded companies. Lynn McKee, 68, most recently served as executive vice president and chief human resources officer for Aramark from 2004 to 2022, where she led the initial human resources strategy related to the spinoff of AUS as a member of the executive leadership team. Prior to this role, Ms. McKee held several key positions for Aramark from 1980 to 2004, including director of employee relations, vice president for corporate human resources, where she was responsible for executive development and compensation, and senior vice president for human resources of Aramark Global Food, Hospitality and Facility Services. In addition, Ms. McKee led Aramark’s corporate communications, diversity, equity and inclusion, sustainability, community relations, corporate real estate and air and meeting services. Ms. McKee is currently a member of the board of directors of WSFS Financial Corporation (NASDAQ: WSFS). Ms. McKee is well qualified to serve on Vestis’ Board of Directors because of her extensive corporate experience in employment, compensation and benefits matters at the regional, national and international levels. In addition to her expertise in human resources, Ms. McKee brings crisis management, corporate governance, executive leadership and public company oversight skills. Lynn McKee Former EVP HR, Aramark Tracy Jokinen Former EVP & CFO, G&K Services, Vyaire Medical Meet the Vestis Board of Directors
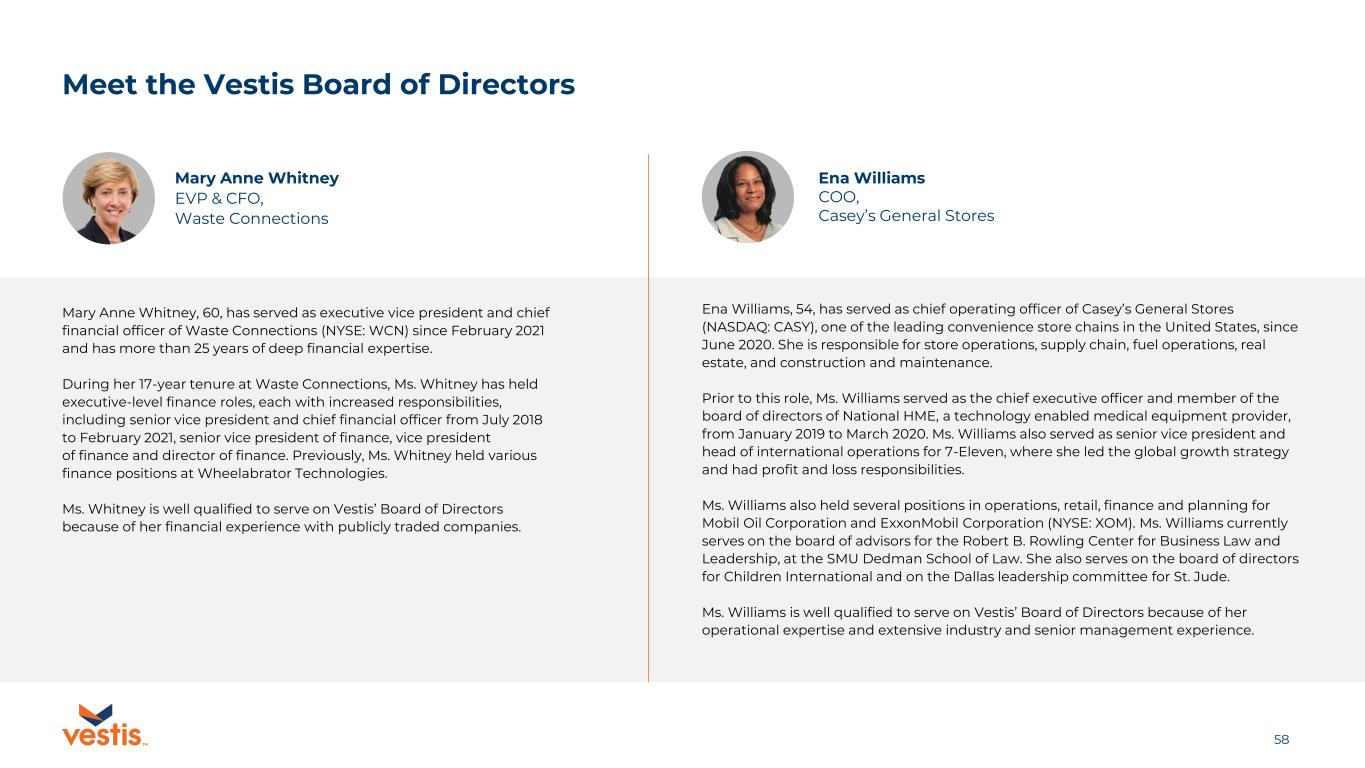
58TM Mary Anne Whitney, 60, has served as executive vice president and chief financial officer of Waste Connections (NYSE: WCN) since February 2021 and has more than 25 years of deep financial expertise. During her 17-year tenure at Waste Connections, Ms. Whitney has held executive-level finance roles, each with increased responsibilities, including senior vice president and chief financial officer from July 2018 to February 2021, senior vice president of finance, vice president of finance and director of finance. Previously, Ms. Whitney held various finance positions at Wheelabrator Technologies. Ms. Whitney is well qualified to serve on Vestis’ Board of Directors because of her financial experience with publicly traded companies. Ena Williams, 54, has served as chief operating officer of Casey’s General Stores (NASDAQ: CASY), one of the leading convenience store chains in the United States, since June 2020. She is responsible for store operations, supply chain, fuel operations, real estate, and construction and maintenance. Prior to this role, Ms. Williams served as the chief executive officer and member of the board of directors of National HME, a technology enabled medical equipment provider, from January 2019 to March 2020. Ms. Williams also served as senior vice president and head of international operations for 7-Eleven, where she led the global growth strategy and had profit and loss responsibilities. Ms. Williams also held several positions in operations, retail, finance and planning for Mobil Oil Corporation and ExxonMobil Corporation (NYSE: XOM). Ms. Williams currently serves on the board of advisors for the Robert B. Rowling Center for Business Law and Leadership, at the SMU Dedman School of Law. She also serves on the board of directors for Children International and on the Dallas leadership committee for St. Jude. Ms. Williams is well qualified to serve on Vestis’ Board of Directors because of her operational expertise and extensive industry and senior management experience. Ena Williams COO, Casey’s General Stores Mary Anne Whitney EVP & CFO, Waste Connections Meet the Vestis Board of Directors
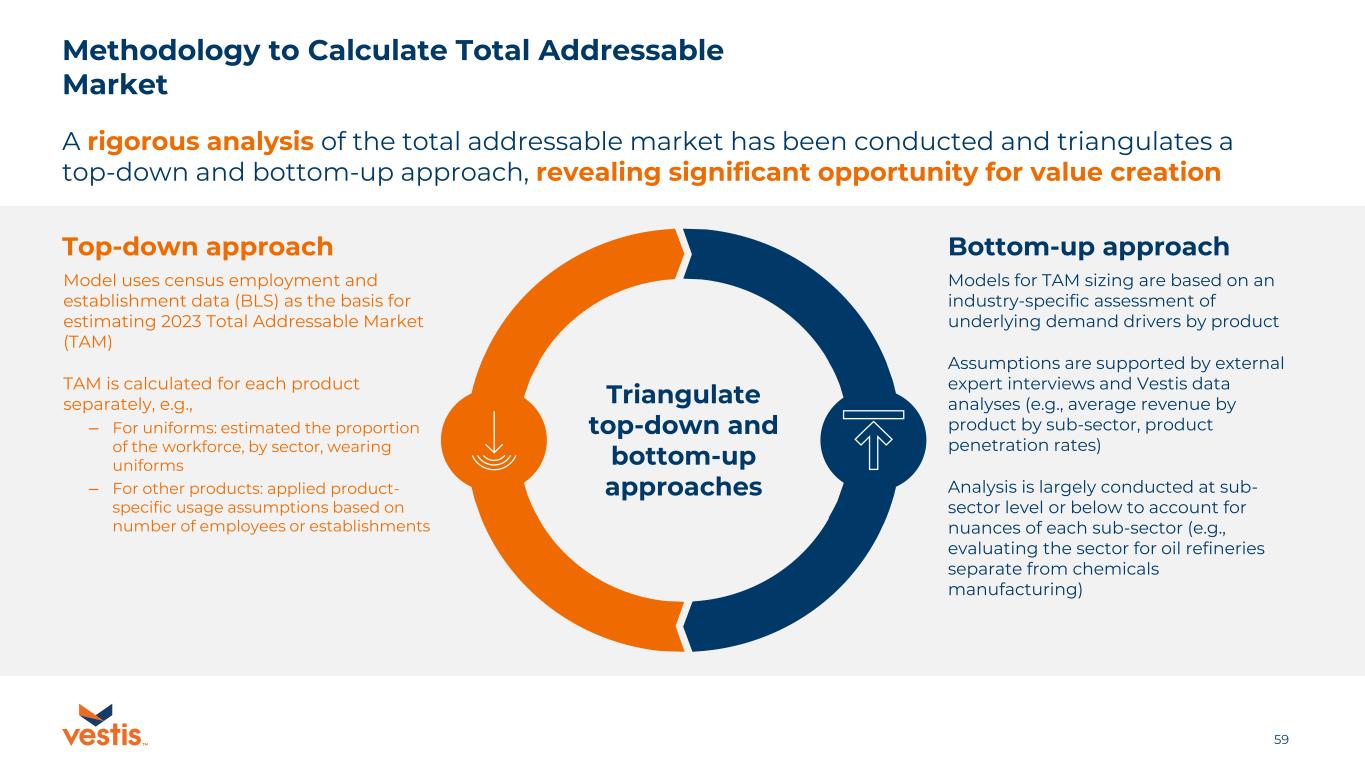
59TM Methodology to Calculate Total Addressable Market Triangulate top-down and bottom-up approaches Bottom-up approachTop-down approach Model uses census employment and establishment data (BLS) as the basis for estimating 2023 Total Addressable Market (TAM) TAM is calculated for each product separately, e.g., ‒ For uniforms: estimated the proportion of the workforce, by sector, wearing uniforms ‒ For other products: applied product- specific usage assumptions based on number of employees or establishments Models for TAM sizing are based on an industry-specific assessment of underlying demand drivers by product Assumptions are supported by external expert interviews and Vestis data analyses (e.g., average revenue by product by sub-sector, product penetration rates) Analysis is largely conducted at sub- sector level or below to account for nuances of each sub-sector (e.g., evaluating the sector for oil refineries separate from chemicals manufacturing) A rigorous analysis of the total addressable market has been conducted and triangulates a top-down and bottom-up approach, revealing significant opportunity for value creation
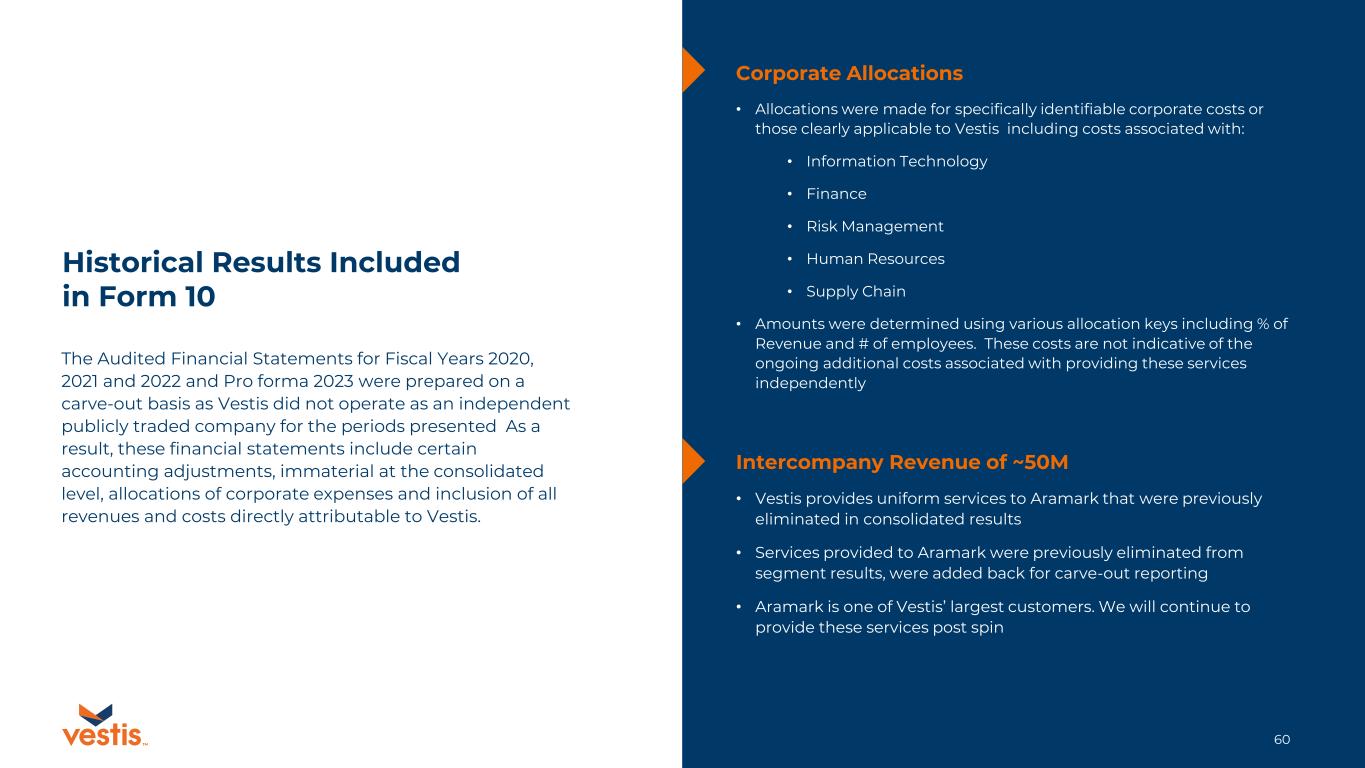
60TM Historical Results Included in Form 10 The Audited Financial Statements for Fiscal Years 2020, 2021 and 2022 and Pro forma 2023 were prepared on a carve-out basis as Vestis did not operate as an independent publicly traded company for the periods presented As a result, these financial statements include certain accounting adjustments, immaterial at the consolidated level, allocations of corporate expenses and inclusion of all revenues and costs directly attributable to Vestis. Corporate Allocations • Allocations were made for specifically identifiable corporate costs or those clearly applicable to Vestis including costs associated with: • Information Technology • Finance • Risk Management • Human Resources • Supply Chain • Amounts were determined using various allocation keys including % of Revenue and # of employees. These costs are not indicative of the ongoing additional costs associated with providing these services independently Intercompany Revenue of ~50M • Vestis provides uniform services to Aramark that were previously eliminated in consolidated results • Services provided to Aramark were previously eliminated from segment results, were added back for carve-out reporting • Aramark is one of Vestis’ largest customers. We will continue to provide these services post spin
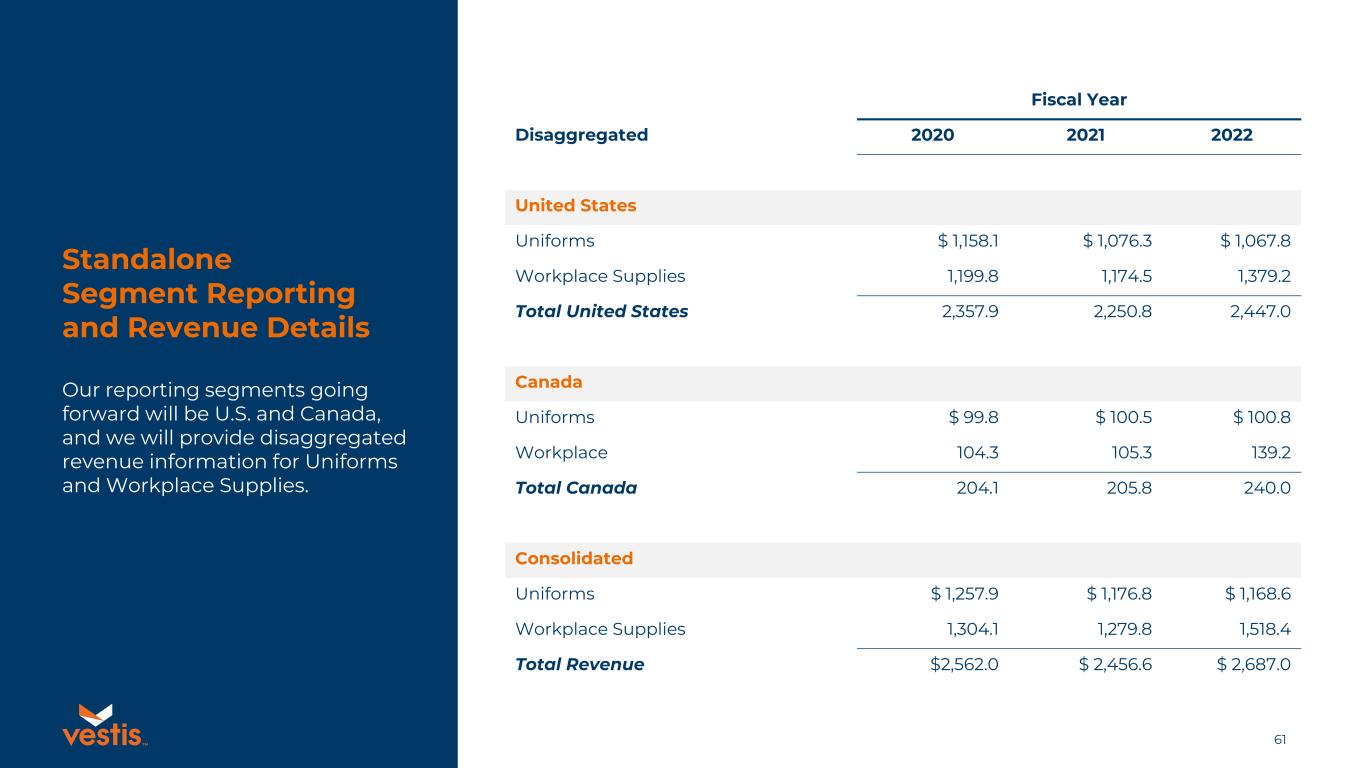
61TM Our reporting segments going forward will be U.S. and Canada, and we will provide disaggregated revenue information for Uniforms and Workplace Supplies. Standalone Segment Reporting and Revenue Details Fiscal Year Disaggregated 2020 2021 2022 United States Uniforms $ 1,158.1 $ 1,076.3 $ 1,067.8 Workplace Supplies 1,199.8 1,174.5 1,379.2 Total United States 2,357.9 2,250.8 2,447.0 Canada Uniforms $ 99.8 $ 100.5 $ 100.8 Workplace 104.3 105.3 139.2 Total Canada 204.1 205.8 240.0 Consolidated Uniforms $ 1,257.9 $ 1,176.8 $ 1,168.6 Workplace Supplies 1,304.1 1,279.8 1,518.4 Total Revenue $2,562.0 $ 2,456.6 $ 2,687.0
62TM Non-GAAP Definitions This presentation includes certain non-GAAP financial measures, which include Organic Revenue Growth, Adjusted Revenue, Adjusted Operating Income, Adjusted Operating Income Margin, Adjusted EBITDA, Adjusted EBITDA Margin and Free Cash Flow. Vestis utilizes these measures when monitoring and evaluating operating performance. The non-GAAP financial measures presented herein are supplemental measures of Vestis’ performance that Vestis believes help investors because they enable better comparisons of Vestis’ historical results and allow Vestis’ investors to evaluate its performance based on the same metrics that Vestis uses to evaluate its performance and trends in its results. Vestis’ presentation of these metrics has limitations as an analytical tool and should not be considered in isolation or as a substitute for analysis of Vestis’ results as reported under U.S. GAAP. Because of their limitations, these non-GAAP financial measures should not be considered as measures of cash available to Vestis to invest in the growth of Vestis’ business or that will be available to Vestis to meet its obligations. Vestis compensates for these limitations by using these non-GAAP financial measures along with other comparative tools, together with U.S. GAAP financial measures, to assist in the evaluation of operating performance. You should not consider these measures as alternatives to revenue, operating income, operating income margin, net income, net income margin or net cash provided by operating activities determined in accordance with U.S. GAAP. Vestis believes that these non-GAAP financial measures, in addition to the corresponding U.S. GAAP financial measures, are important supplemental measures which exclude non-cash or other items that may not be indicative of or are unrelated to Vestis’ core operating results and the overall health of Vestis. Non-GAAP financial measures as presented by Vestis may not be comparable to other similarly titled measures of other companies because not all companies use identical calculations. Organic Revenue Growth Organic revenue growth measures our revenue growth trends excluding the impact of acquisitions and foreign currency, and we believe it is useful for investors to understand growth through internal efforts. We define “organic revenue growth” as the growth in revenues, excluding (i) Acquistions and (ii) the impact of foreign currency exchange rate changes, (iii) the impact of the 53rd week. Adjusted Revenue Adjusted Revenue for 2019, 2020, 2021 and 2022 represents revenue as determined in accordance with U.S. GAAP, adjusted in the case of [2020] to eliminate the impact of the 53rd Week. Adjusted Operating Income Adjusted Operating Income represents Operating Income adjusted for Amortization Expense of Acquired Intangibles; Severance and Other Charges; Merger and Integration Related Charges; Separation Related Charges; Estimated Impact of 53rd Week; and Gain, Losses, Settlements and Other Items impacting comparability. Adjusted results are presented in order to reflect the results in a manner that allows a better understanding of operational activities separate from the financial impact of decisions made for the long-term benefit of the company and other items impacting comparability between periods. Similar adjustments have been recorded in earlier periods and similar types of adjustments can reasonably be expected to be recorded in future periods. Adjusted Operating Income Margin Adjusted Operating Income Margin represents Adjusted Operating Income as a percentage of Adjusted Revenue. Adjusted EBITDA Adjusted EBITDA represents Net Income adjusted for Provision for Income Taxes; Interest Expense and Other, net; and Depreciation and Amortization (EBTIDA), further adjusted for Severeance and Other Charges, Merger and Integration Charges, Separation Related Charges, Estimated Impact of 53rd Week, Gain, Losses, Settlements and other items impacting comparability. Adjusted results are presented in order to reflect the results in a manner that allows a better understanding of operational activities separate from the financial impact of decisions made for the long-term benefit of the company and other items impacting comparability between periods. Similar adjustments have been recorded in earlier periods and similar types of adjustments can reasonably be expected to be recorded in future periods. Adjusted EBITDA Margin is Adjusted EBITDA as a percentage of Adjusted Revenue. Free Cash Flow Free Cash Flow represents Net cash provided by operating activities adjusted for Purchases of Property and Equipment and Other and Disposals of property and equipment.
63TM Forward Looking Non-GAAP Information This presentation also includes certain non-GAAP financial information that is forward-looking in nature, including without limitation compound annual organic revenue growth for fiscal year 2023-2028 and adjusted EBITDA margin for fiscal year 2028. Vestis believes that a quantitative reconciliation of such forward-looking information to the most comparable financial measure calculated and presented in accordance with GAAP cannot be made available without unreasonable efforts. A reconciliation of these non-GAAP financial measures would require Vestis to predict the timing and likelihood of among other things future acquisitions and divestitures, restructurings, asset impairments, other charges and other factors not within Vestis’ control. Neither these forward-looking measures, nor their probable significance, can be quantified with a reasonable degree of accuracy. Accordingly, the most directly comparable forward-looking GAAP measures are not provided. Forward-looking non-GAAP financial measures provided without the most directly comparable GAAP financial measures may vary materially from the corresponding GAAP financial measures. The estimates of compound annual organic revenue growth for fiscal year 2023-2028 and adjusted EBITDA margin for fiscal year 2028 do not attempt to forecast currency fluctuations and, accordingly, reflect an assumption of constant currency.
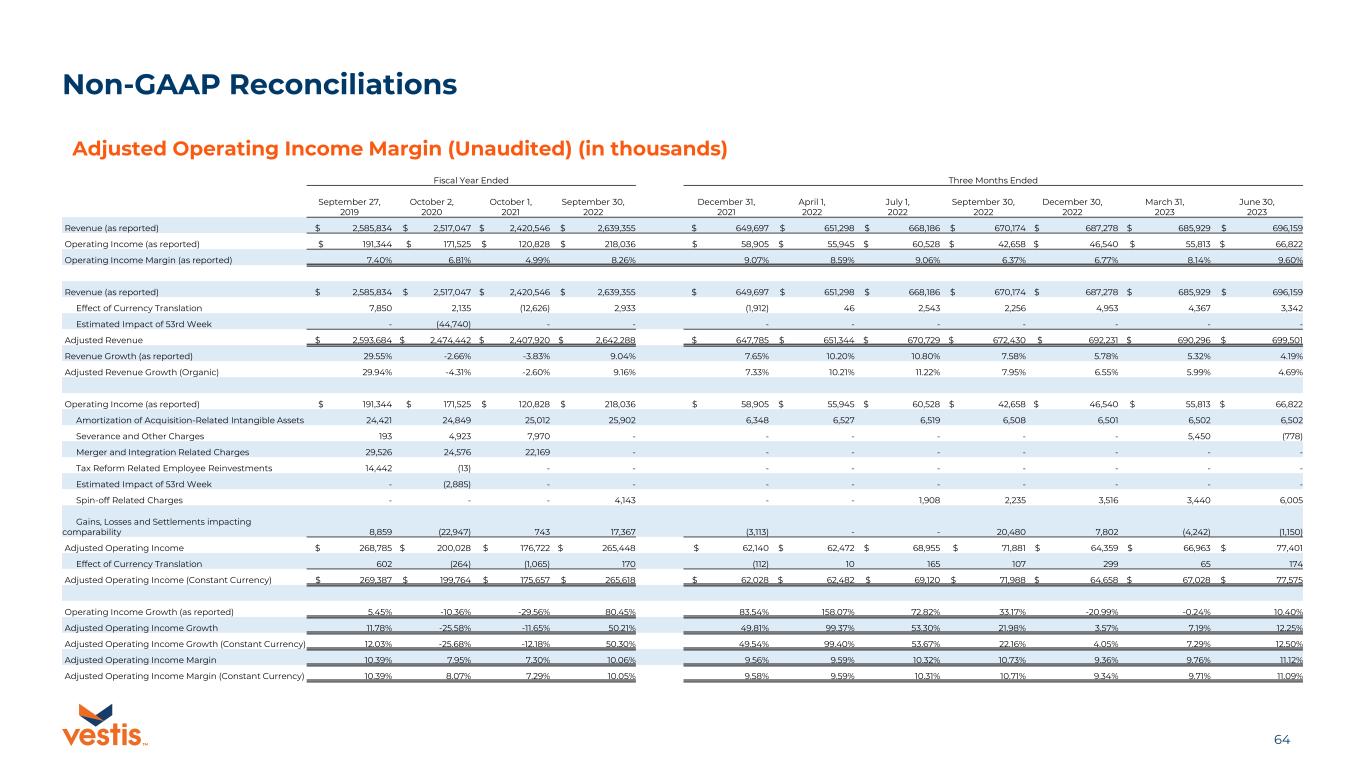
64TM Non-GAAP Reconciliations Adjusted Operating Income Margin (Unaudited) (in thousands) Fiscal Year Ended Three Months Ended September 27, 2019 October 2, 2020 October 1, 2021 September 30, 2022 December 31, 2021 April 1, 2022 July 1, 2022 September 30, 2022 December 30, 2022 March 31, 2023 June 30, 2023 Revenue (as reported) $ 2,585,834 $ 2,517,047 $ 2,420,546 $ 2,639,355 $ 649,697 $ 651,298 $ 668,186 $ 670,174 $ 687,278 $ 685,929 $ 696,159 Operating Income (as reported) $ 191,344 $ 171,525 $ 120,828 $ 218,036 $ 58,905 $ 55,945 $ 60,528 $ 42,658 $ 46,540 $ 55,813 $ 66,822 Operating Income Margin (as reported) 7.40% 6.81% 4.99% 8.26% 9.07% 8.59% 9.06% 6.37% 6.77% 8.14% 9.60% Revenue (as reported) $ 2,585,834 $ 2,517,047 $ 2,420,546 $ 2,639,355 $ 649,697 $ 651,298 $ 668,186 $ 670,174 $ 687,278 $ 685,929 $ 696,159 Effect of Currency Translation 7,850 2,135 (12,626) 2,933 (1,912) 46 2,543 2,256 4,953 4,367 3,342 Estimated Impact of 53rd Week - (44,740) - - - - - - - - - Adjusted Revenue $ 2,593,684 $ 2,474,442 $ 2,407,920 $ 2,642,288 $ 647,785 $ 651,344 $ 670,729 $ 672,430 $ 692,231 $ 690,296 $ 699,501 Revenue Growth (as reported) 29.55% -2.66% -3.83% 9.04% 7.65% 10.20% 10.80% 7.58% 5.78% 5.32% 4.19% Adjusted Revenue Growth (Organic) 29.94% -4.31% -2.60% 9.16% 7.33% 10.21% 11.22% 7.95% 6.55% 5.99% 4.69% Operating Income (as reported) $ 191,344 $ 171,525 $ 120,828 $ 218,036 $ 58,905 $ 55,945 $ 60,528 $ 42,658 $ 46,540 $ 55,813 $ 66,822 Amortization of Acquisition-Related Intangible Assets 24,421 24,849 25,012 25,902 6,348 6,527 6,519 6,508 6,501 6,502 6,502 Severance and Other Charges 193 4,923 7,970 - - - - - - 5,450 (778) Merger and Integration Related Charges 29,526 24,576 22,169 - - - - - - - - Tax Reform Related Employee Reinvestments 14,442 (13) - - - - - - - - - Estimated Impact of 53rd Week - (2,885) - - - - - - - - - Spin-off Related Charges - - - 4,143 - - 1,908 2,235 3,516 3,440 6,005 Gains, Losses and Settlements impacting comparability 8,859 (22,947) 743 17,367 (3,113) - - 20,480 7,802 (4,242) (1,150) Adjusted Operating Income $ 268,785 $ 200,028 $ 176,722 $ 265,448 $ 62,140 $ 62,472 $ 68,955 $ 71,881 $ 64,359 $ 66,963 $ 77,401 Effect of Currency Translation 602 (264) (1,065) 170 (112) 10 165 107 299 65 174 Adjusted Operating Income (Constant Currency) $ 269,387 $ 199,764 $ 175,657 $ 265,618 $ 62,028 $ 62,482 $ 69,120 $ 71,988 $ 64,658 $ 67,028 $ 77,575 Operating Income Growth (as reported) 5.45% -10.36% -29.56% 80.45% 83.54% 158.07% 72.82% 33.17% -20.99% -0.24% 10.40% Adjusted Operating Income Growth 11.78% -25.58% -11.65% 50.21% 49.81% 99.37% 53.30% 21.98% 3.57% 7.19% 12.25% Adjusted Operating Income Growth (Constant Currency) 12.03% -25.68% -12.18% 50.30% 49.54% 99.40% 53.67% 22.16% 4.05% 7.29% 12.50% Adjusted Operating Income Margin 10.39% 7.95% 7.30% 10.06% 9.56% 9.59% 10.32% 10.73% 9.36% 9.76% 11.12% Adjusted Operating Income Margin (Constant Currency) 10.39% 8.07% 7.29% 10.05% 9.58% 9.59% 10.31% 10.71% 9.34% 9.71% 11.09%
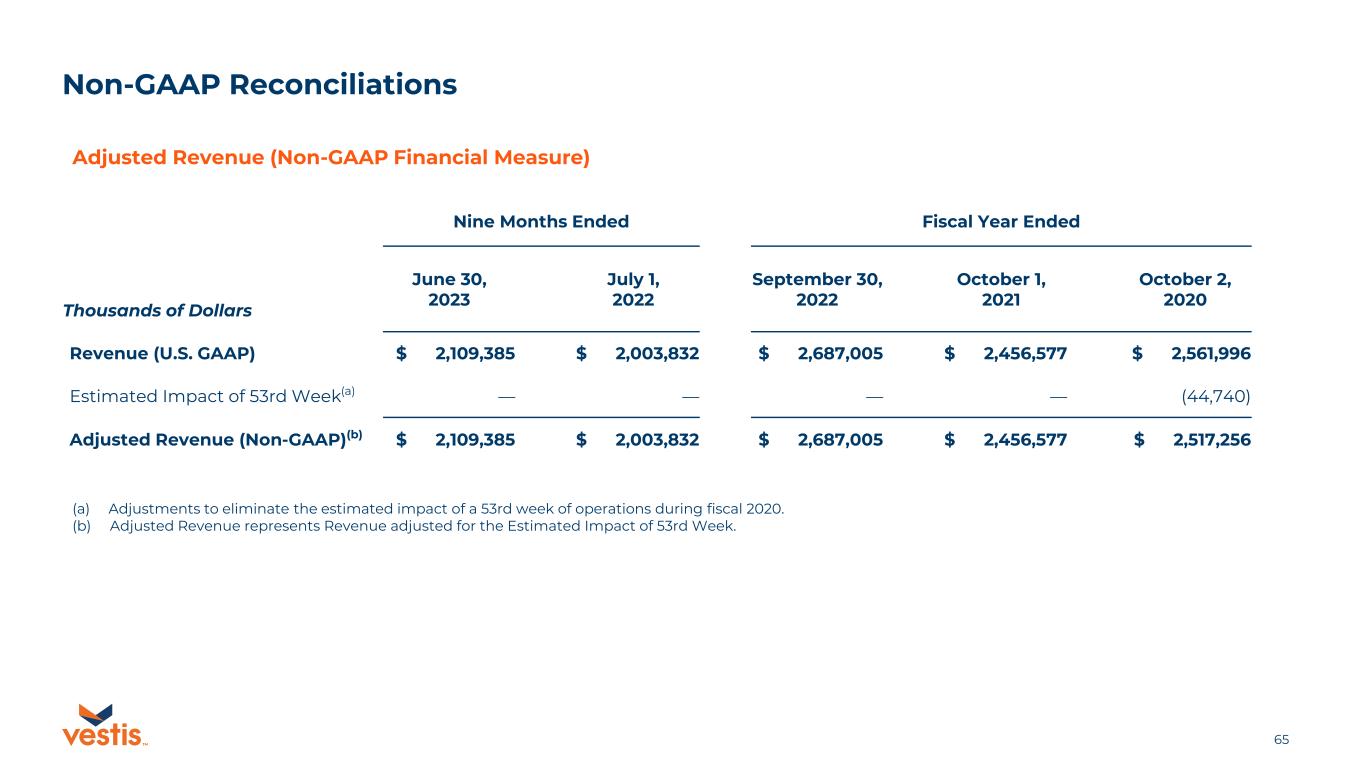
65TM Non-GAAP Reconciliations Nine Months Ended Fiscal Year Ended June 30, 2023 July 1, 2022 September 30, 2022 October 1, 2021 October 2, 2020 Thousands of Dollars Revenue (U.S. GAAP) $ 2,109,385 $ 2,003,832 $ 2,687,005 $ 2,456,577 $ 2,561,996 Estimated Impact of 53rd Week(a) — — — — (44,740) Adjusted Revenue (Non-GAAP)(b) $ 2,109,385 $ 2,003,832 $ 2,687,005 $ 2,456,577 $ 2,517,256 Adjusted Revenue (Non-GAAP Financial Measure) (a) Adjustments to eliminate the estimated impact of a 53rd week of operations during fiscal 2020. (b) Adjusted Revenue represents Revenue adjusted for the Estimated Impact of 53rd Week.
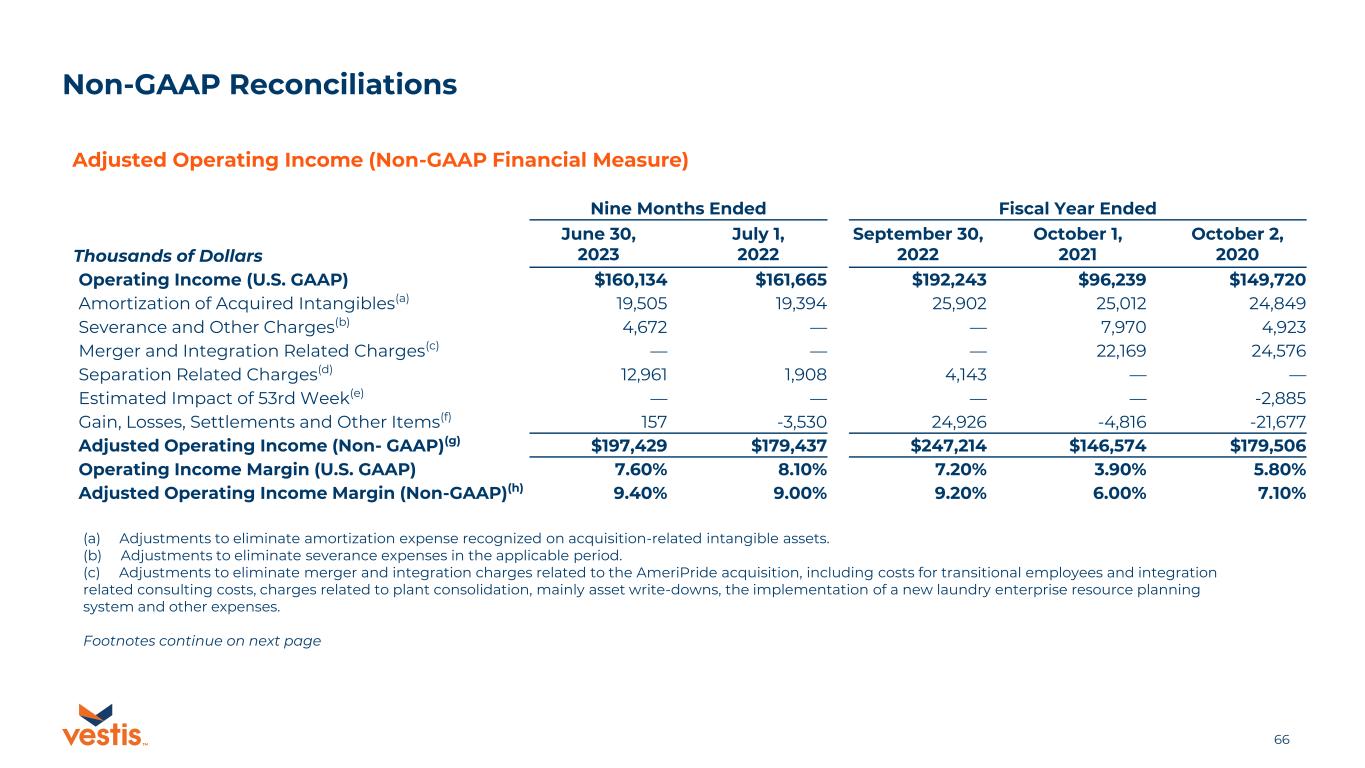
66TM Non-GAAP Reconciliations Adjusted Operating Income (Non-GAAP Financial Measure) Nine Months Ended Fiscal Year Ended June 30, 2023 July 1, 2022 September 30, 2022 October 1, 2021 October 2, 2020Thousands of Dollars Operating Income (U.S. GAAP) $160,134 $161,665 $192,243 $96,239 $149,720 Amortization of Acquired Intangibles(a) 19,505 19,394 25,902 25,012 24,849 Severance and Other Charges(b) 4,672 — — 7,970 4,923 Merger and Integration Related Charges(c) — — — 22,169 24,576 Separation Related Charges(d) 12,961 1,908 4,143 — — Estimated Impact of 53rd Week(e) — — — — -2,885 Gain, Losses, Settlements and Other Items(f) 157 -3,530 24,926 -4,816 -21,677 Adjusted Operating Income (Non- GAAP)(g) $197,429 $179,437 $247,214 $146,574 $179,506 Operating Income Margin (U.S. GAAP) 7.60% 8.10% 7.20% 3.90% 5.80% Adjusted Operating Income Margin (Non-GAAP)(h) 9.40% 9.00% 9.20% 6.00% 7.10% (a) Adjustments to eliminate amortization expense recognized on acquisition-related intangible assets. (b) Adjustments to eliminate severance expenses in the applicable period. (c) Adjustments to eliminate merger and integration charges related to the AmeriPride acquisition, including costs for transitional employees and integration related consulting costs, charges related to plant consolidation, mainly asset write-downs, the implementation of a new laundry enterprise resource planning system and other expenses. Footnotes continue on next page
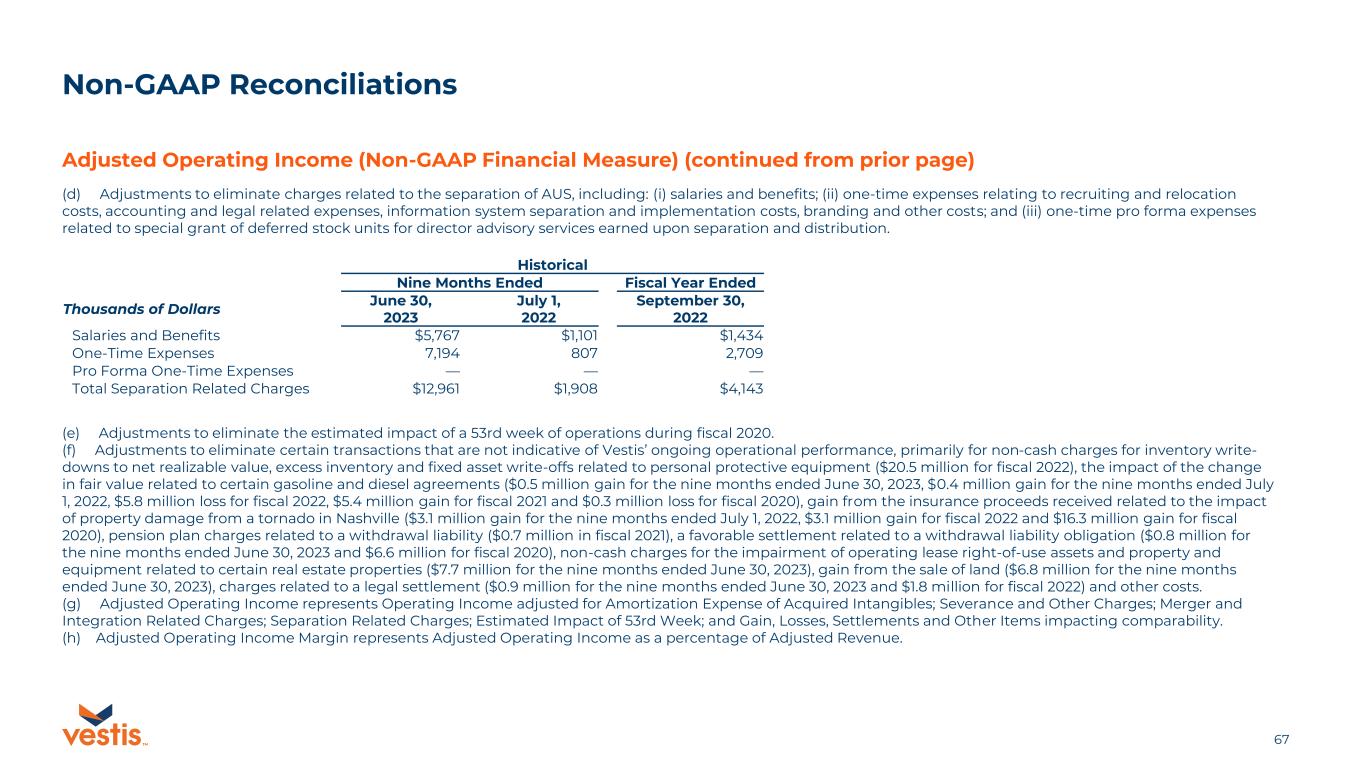
67TM Non-GAAP Reconciliations Adjusted Operating Income (Non-GAAP Financial Measure) (continued from prior page) Historical Nine Months Ended Fiscal Year Ended Thousands of Dollars June 30, 2023 July 1, 2022 September 30, 2022 Salaries and Benefits $5,767 $1,101 $1,434 One-Time Expenses 7,194 807 2,709 Pro Forma One-Time Expenses — — — Total Separation Related Charges $12,961 $1,908 $4,143 (d) Adjustments to eliminate charges related to the separation of AUS, including: (i) salaries and benefits; (ii) one-time expenses relating to recruiting and relocation costs, accounting and legal related expenses, information system separation and implementation costs, branding and other costs; and (iii) one-time pro forma expenses related to special grant of deferred stock units for director advisory services earned upon separation and distribution. (e) Adjustments to eliminate the estimated impact of a 53rd week of operations during fiscal 2020. (f) Adjustments to eliminate certain transactions that are not indicative of Vestis’ ongoing operational performance, primarily for non-cash charges for inventory write- downs to net realizable value, excess inventory and fixed asset write-offs related to personal protective equipment ($20.5 million for fiscal 2022), the impact of the change in fair value related to certain gasoline and diesel agreements ($0.5 million gain for the nine months ended June 30, 2023, $0.4 million gain for the nine months ended July 1, 2022, $5.8 million loss for fiscal 2022, $5.4 million gain for fiscal 2021 and $0.3 million loss for fiscal 2020), gain from the insurance proceeds received related to the impact of property damage from a tornado in Nashville ($3.1 million gain for the nine months ended July 1, 2022, $3.1 million gain for fiscal 2022 and $16.3 million gain for fiscal 2020), pension plan charges related to a withdrawal liability ($0.7 million in fiscal 2021), a favorable settlement related to a withdrawal liability obligation ($0.8 million for the nine months ended June 30, 2023 and $6.6 million for fiscal 2020), non-cash charges for the impairment of operating lease right-of-use assets and property and equipment related to certain real estate properties ($7.7 million for the nine months ended June 30, 2023), gain from the sale of land ($6.8 million for the nine months ended June 30, 2023), charges related to a legal settlement ($0.9 million for the nine months ended June 30, 2023 and $1.8 million for fiscal 2022) and other costs. (g) Adjusted Operating Income represents Operating Income adjusted for Amortization Expense of Acquired Intangibles; Severance and Other Charges; Merger and Integration Related Charges; Separation Related Charges; Estimated Impact of 53rd Week; and Gain, Losses, Settlements and Other Items impacting comparability. (h) Adjusted Operating Income Margin represents Adjusted Operating Income as a percentage of Adjusted Revenue.
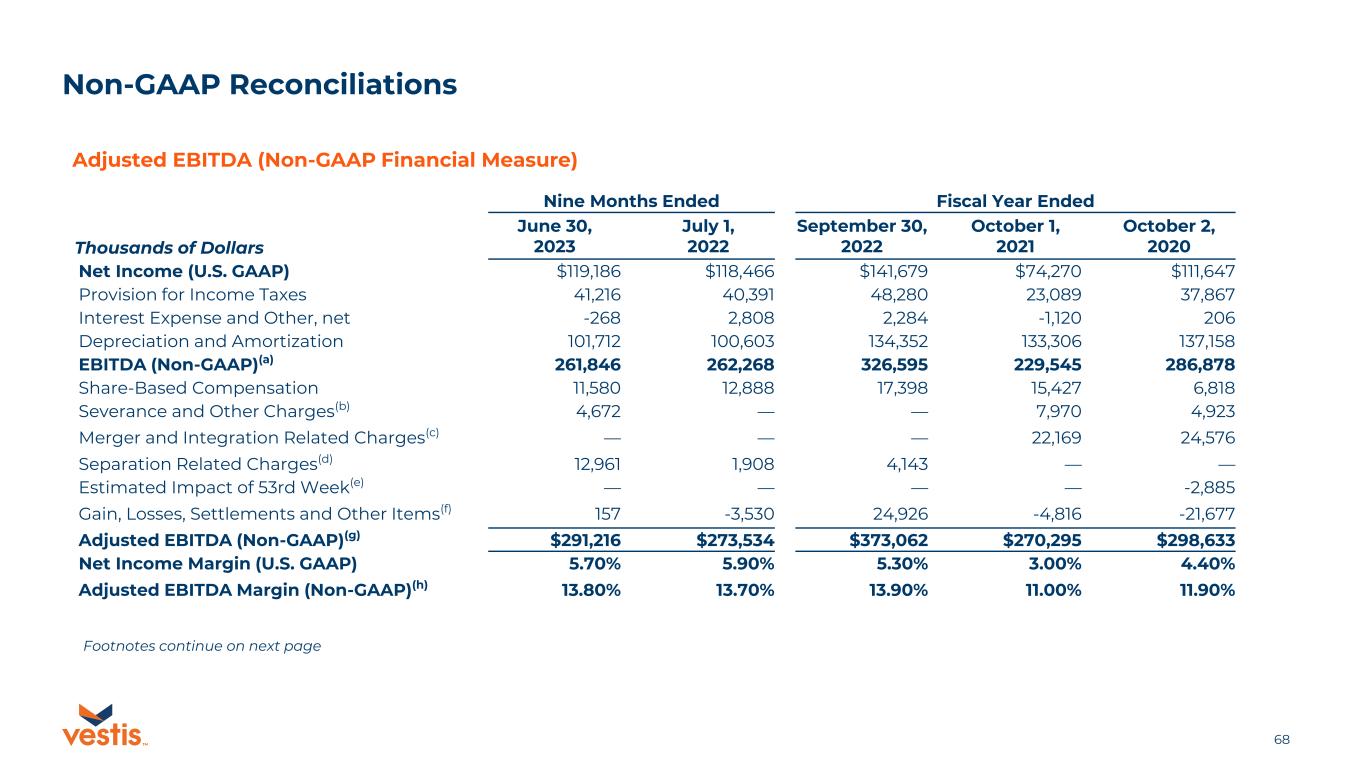
68TM Non-GAAP Reconciliations Adjusted EBITDA (Non-GAAP Financial Measure) Nine Months Ended Fiscal Year Ended June 30, 2023 July 1, 2022 September 30, 2022 October 1, 2021 October 2, 2020Thousands of Dollars Net Income (U.S. GAAP) $119,186 $118,466 $141,679 $74,270 $111,647 Provision for Income Taxes 41,216 40,391 48,280 23,089 37,867 Interest Expense and Other, net -268 2,808 2,284 -1,120 206 Depreciation and Amortization 101,712 100,603 134,352 133,306 137,158 EBITDA (Non-GAAP)(a) 261,846 262,268 326,595 229,545 286,878 Share-Based Compensation 11,580 12,888 17,398 15,427 6,818 Severance and Other Charges(b) 4,672 — — 7,970 4,923 Merger and Integration Related Charges(c) — — — 22,169 24,576 Separation Related Charges(d) 12,961 1,908 4,143 — — Estimated Impact of 53rd Week(e) — — — — -2,885 Gain, Losses, Settlements and Other Items(f) 157 -3,530 24,926 -4,816 -21,677 Adjusted EBITDA (Non-GAAP)(g) $291,216 $273,534 $373,062 $270,295 $298,633 Net Income Margin (U.S. GAAP) 5.70% 5.90% 5.30% 3.00% 4.40% Adjusted EBITDA Margin (Non-GAAP)(h) 13.80% 13.70% 13.90% 11.00% 11.90% Footnotes continue on next page
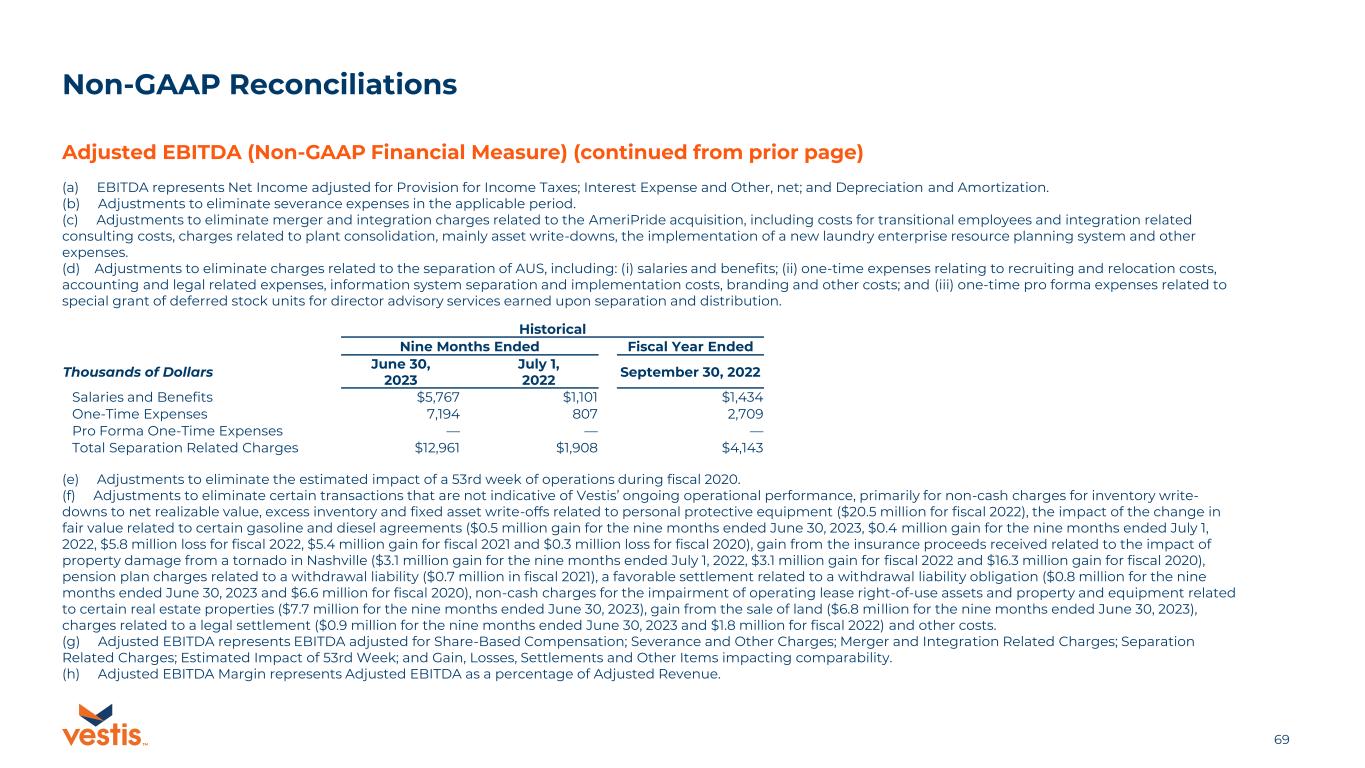
69TM Non-GAAP Reconciliations Adjusted EBITDA (Non-GAAP Financial Measure) (continued from prior page) (a) EBITDA represents Net Income adjusted for Provision for Income Taxes; Interest Expense and Other, net; and Depreciation and Amortization. (b) Adjustments to eliminate severance expenses in the applicable period. (c) Adjustments to eliminate merger and integration charges related to the AmeriPride acquisition, including costs for transitional employees and integration related consulting costs, charges related to plant consolidation, mainly asset write-downs, the implementation of a new laundry enterprise resource planning system and other expenses. (d) Adjustments to eliminate charges related to the separation of AUS, including: (i) salaries and benefits; (ii) one-time expenses relating to recruiting and relocation costs, accounting and legal related expenses, information system separation and implementation costs, branding and other costs; and (iii) one-time pro forma expenses related to special grant of deferred stock units for director advisory services earned upon separation and distribution. (e) Adjustments to eliminate the estimated impact of a 53rd week of operations during fiscal 2020. (f) Adjustments to eliminate certain transactions that are not indicative of Vestis’ ongoing operational performance, primarily for non-cash charges for inventory write- downs to net realizable value, excess inventory and fixed asset write-offs related to personal protective equipment ($20.5 million for fiscal 2022), the impact of the change in fair value related to certain gasoline and diesel agreements ($0.5 million gain for the nine months ended June 30, 2023, $0.4 million gain for the nine months ended July 1, 2022, $5.8 million loss for fiscal 2022, $5.4 million gain for fiscal 2021 and $0.3 million loss for fiscal 2020), gain from the insurance proceeds received related to the impact of property damage from a tornado in Nashville ($3.1 million gain for the nine months ended July 1, 2022, $3.1 million gain for fiscal 2022 and $16.3 million gain for fiscal 2020), pension plan charges related to a withdrawal liability ($0.7 million in fiscal 2021), a favorable settlement related to a withdrawal liability obligation ($0.8 million for the nine months ended June 30, 2023 and $6.6 million for fiscal 2020), non-cash charges for the impairment of operating lease right-of-use assets and property and equipment related to certain real estate properties ($7.7 million for the nine months ended June 30, 2023), gain from the sale of land ($6.8 million for the nine months ended June 30, 2023), charges related to a legal settlement ($0.9 million for the nine months ended June 30, 2023 and $1.8 million for fiscal 2022) and other costs. (g) Adjusted EBITDA represents EBITDA adjusted for Share-Based Compensation; Severance and Other Charges; Merger and Integration Related Charges; Separation Related Charges; Estimated Impact of 53rd Week; and Gain, Losses, Settlements and Other Items impacting comparability. (h) Adjusted EBITDA Margin represents Adjusted EBITDA as a percentage of Adjusted Revenue. Historical Nine Months Ended Fiscal Year Ended Thousands of Dollars June 30, 2023 July 1, 2022 September 30, 2022 Salaries and Benefits $5,767 $1,101 $1,434 One-Time Expenses 7,194 807 2,709 Pro Forma One-Time Expenses — — — Total Separation Related Charges $12,961 $1,908 $4,143