EX-99.2
Published on May 6, 2025
Second Quarter 2025 Results TM May 6, 2025 Exhibit 99.2
2TM Forward Looking Statements This presentation contains “forward-looking statements” within the meaning of the securities laws. All statements that reflect our expectations, assumptions or projections about the future, other than statements of historical fact, are forward-looking statements, including, without limitation, statements relating to future operations and financial performance and statements regarding our strategy for growth, future product development, regulatory approvals, competitive position and expenditures. In some cases, forward-looking statements can be identified by words such as “continue to,” “strategy,” “guidance,” “opportunities,” “focus,” “expect,” “will be,” “believe,” and other words and terms of similar meaning or the negative versions of such words. These forward-looking statements are subject to risks and uncertainties that may change at any time, and actual results or outcomes may differ materially from those that we expected. Forward- looking statements are not guarantees of future performance and are subject to risks, uncertainties, and changes in circumstances that are difficult to predict including, but not limited to: unfavorable economic conditions; increases in fuel and energy costs; the failure to retain current customers, renew existing customer contracts and obtain new customer contracts; natural disasters, global calamities, climate change, pandemics, strikes and other adverse incidents; competition in our industry; increased operating costs and obstacles to cost recovery due to the pricing and cancellation terms of our support services contracts; our leverage and reliance on an accounts receivable securitization facility; a determination by our customers to reduce their outsourcing or use of preferred vendors; risks associated with suppliers from whom our products are sourced; challenge of contracts by our customers; our expansion strategy and our ability to successfully integrate the businesses we acquire and costs and timing related thereto; currency risks and other risks associated with international operations; our inability to hire and retain key or sufficient qualified personnel or increases in labor costs; continued or further unionization of our workforce; liability resulting from our participation in multiemployer-defined benefit pension plans; liability associated with noncompliance with applicable law or other governmental regulations; laws and governmental regulations including those relating to the environment, wage and hour and government contracting; increases or changes in income tax rates or tax-related laws; risks related to recent U.S. tariff announcements; new interpretations of or changes in the enforcement of the government regulatory framework; a cybersecurity incident or other disruptions in the availability of our computer systems or privacy breaches; stakeholder expectations relating to environmental, social and governance considerations; any failure by Aramark to perform its obligations under the various separation agreements entered into in connection with the separation and distribution; a determination by the IRS that the distribution or certain related transactions are taxable; and the timing and occurrence (or non-occurrence) of other transactions, events and circumstances which may be beyond our control. The above list of factors is not exhaustive or necessarily in order of importance. For additional information on identifying factors that may cause actual results to vary materially from those stated in forward-looking statements, see Vestis’ filings with the Securities and Exchange Commission. Any forward- looking statement speaks only as of the date on which it is made, and we assume no obligation to update or revise such statement, whether as a result of new information, future events or otherwise, except as required by applicable law.
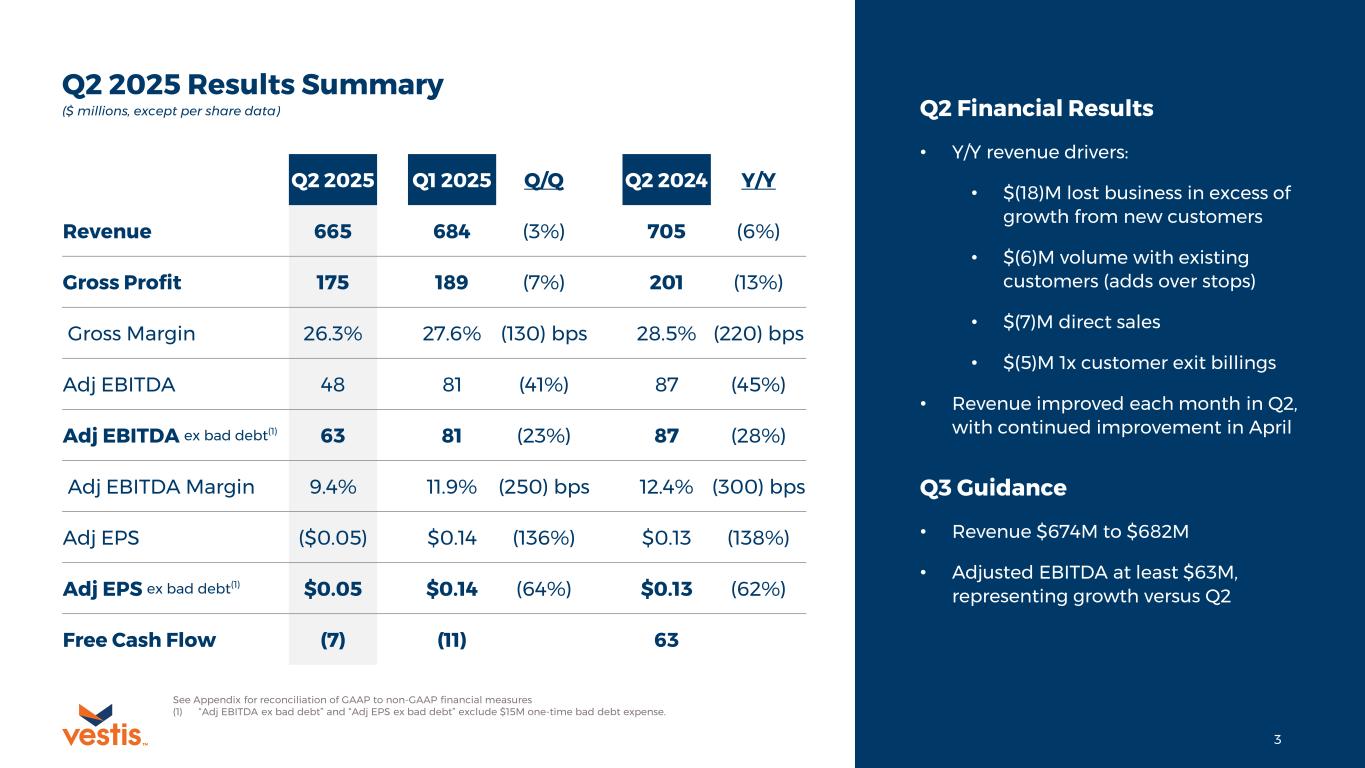
3TM See Appendix for reconciliation of GAAP to non-GAAP financial measures (1) “Adj EBITDA ex bad debt” and “Adj EPS ex bad debt” exclude $15M one-time bad debt expense. Q2 2025 Results Summary Q2 Financial Results • Y/Y revenue drivers: • $(18)M lost business in excess of growth from new customers • $(6)M volume with existing customers (adds over stops) • $(7)M direct sales • $(5)M 1x customer exit billings • Revenue improved each month in Q2, with continued improvement in April Q3 Guidance • Revenue $674M to $682M • Adjusted EBITDA at least $63M, representing growth versus Q2 ($ millions, except per share data) Q2 2025 Q1 2025 Q/Q Q2 2024 Y/Y Revenue 665 684 (3%) 705 (6%) Gross Profit 175 189 (7%) 201 (13%) Gross Margin 26.3% 27.6% (130) bps 28.5% (220) bps Adj EBITDA 48 81 (41%) 87 (45%) Adj EBITDA ex bad debt(1) 63 81 (23%) 87 (28%) Adj EBITDA Margin 9.4% 11.9% (250) bps 12.4% (300) bps Adj EPS ($0.05) $0.14 (136%) $0.13 (138%) Adj EPS ex bad debt(1) $0.05 $0.14 (64%) $0.13 (62%) Free Cash Flow (7) (11) 63
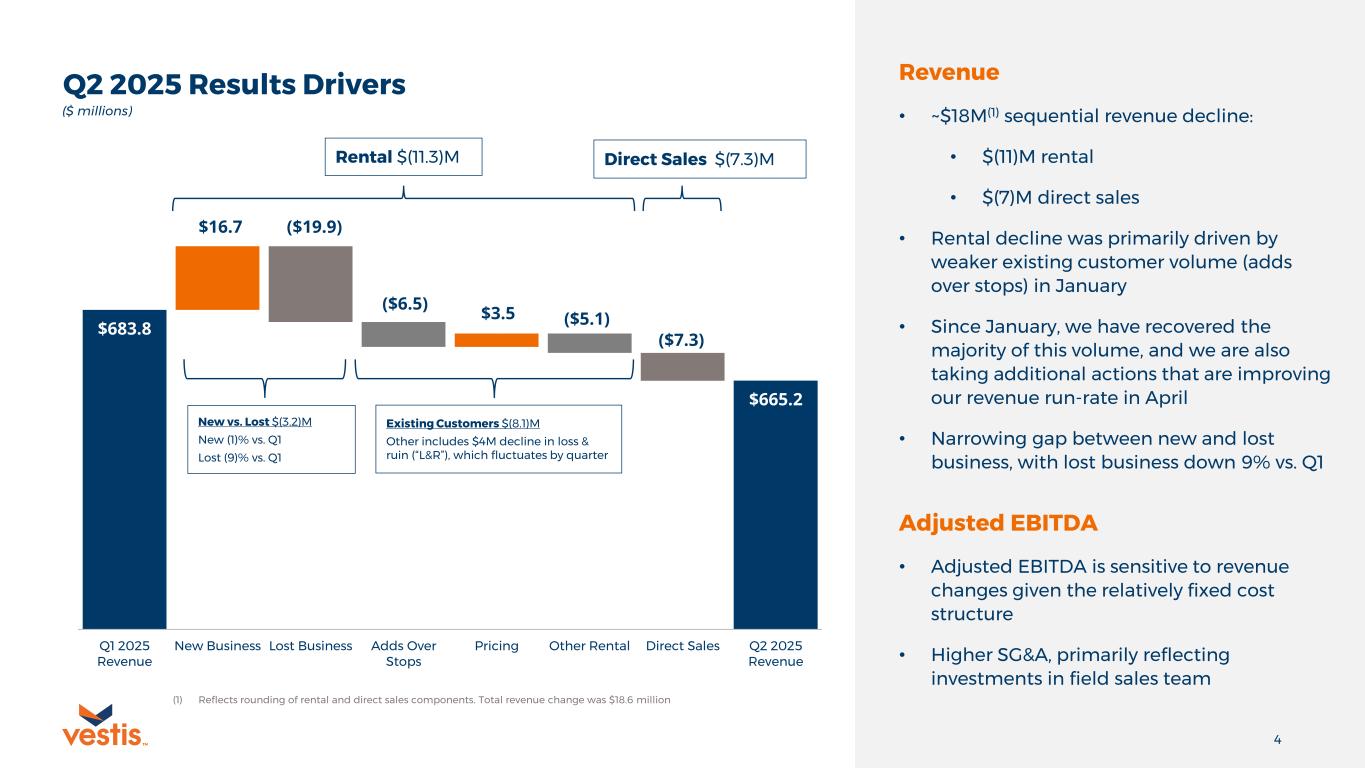
4TM Q2 2025 Results Drivers ($ millions) Revenue • ~$18M(1) sequential revenue decline: • $(11)M rental • $(7)M direct sales • Rental decline was primarily driven by weaker existing customer volume (adds over stops) in January • Since January, we have recovered the majority of this volume, and we are also taking additional actions that are improving our revenue run-rate in April • Narrowing gap between new and lost business, with lost business down 9% vs. Q1 Adjusted EBITDA • Adjusted EBITDA is sensitive to revenue changes given the relatively fixed cost structure • Higher SG&A, primarily reflecting investments in field sales team $683.8 $665.2 $16.7 ($19.9) ($6.5) $3.5 ($5.1) ($7.3) 600.0 620.0 640.0 660.0 680.0 700.0 Q1 2025 Revenue New Business Lost Business Adds Over Stops Pricing Other Rental Direct Sales Q2 2025 Revenue New vs. Lost $(3.2)M New (1)% vs. Q1 Lost (9)% vs. Q1 Rental $(11.3)M Direct Sales $(7.3)M Existing Customers $(8.1)M Other includes $4M decline in loss & ruin (“L&R”), which fluctuates by quarter (1) Reflects rounding of rental and direct sales components. Total revenue change was $18.6 million
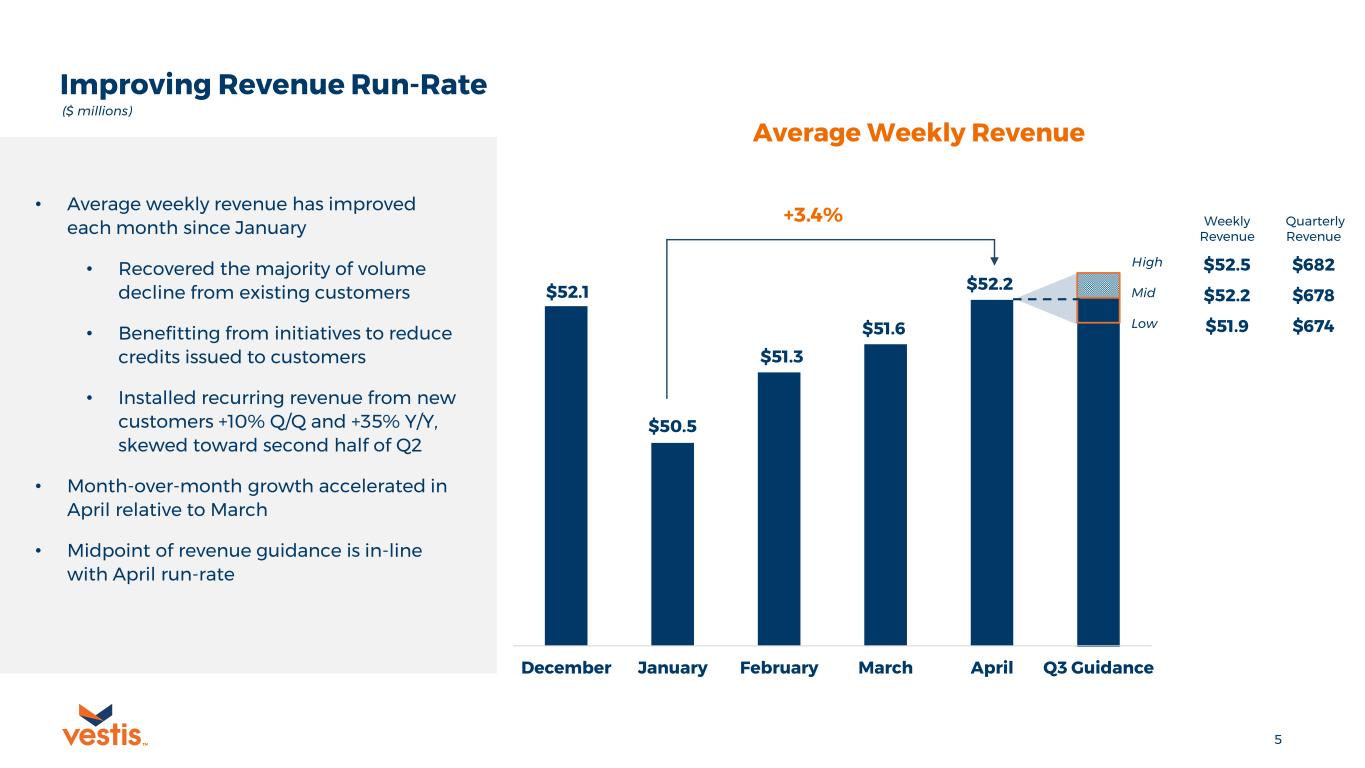
5TM $52.1 $50.5 $51.3 $51.6 $52.2 48 48.5 49 49.5 50 50.5 51 51.5 52 52.5 53 December January February March April Q3 Guidance Average Weekly Revenue ($ millions) +3.4% Weekly Revenue Quarterly Revenue High $52.5 $682 Mid $52.2 $678 Low $51.9 $674 Improving Revenue Run-Rate • Average weekly revenue has improved each month since January • Recovered the majority of volume decline from existing customers • Benefitting from initiatives to reduce credits issued to customers • Installed recurring revenue from new customers +10% Q/Q and +35% Y/Y, skewed toward second half of Q2 • Month-over-month growth accelerated in April relative to March • Midpoint of revenue guidance is in-line with April run-rate
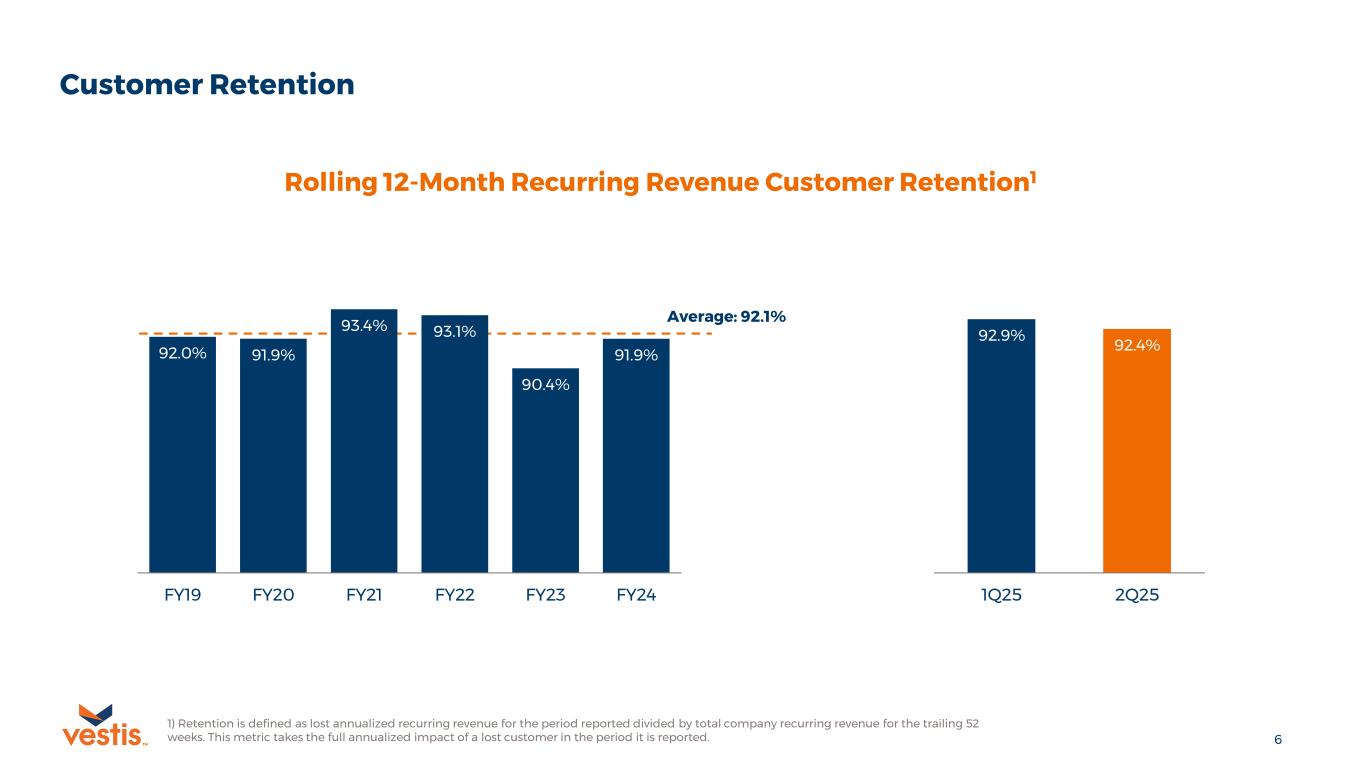
6TM 92.0% 91.9% 93.4% 93.1% 90.4% 91.9% FY19 FY20 FY21 FY22 FY23 FY24 Customer Retention Rolling 12-Month Recurring Revenue Customer Retention1 92.9% 92.4% 1Q25 2Q25 1) Retention is defined as lost annualized recurring revenue for the period reported divided by total company recurring revenue for the trailing 52 weeks. This metric takes the full annualized impact of a lost customer in the period it is reported. Average: 92.1%
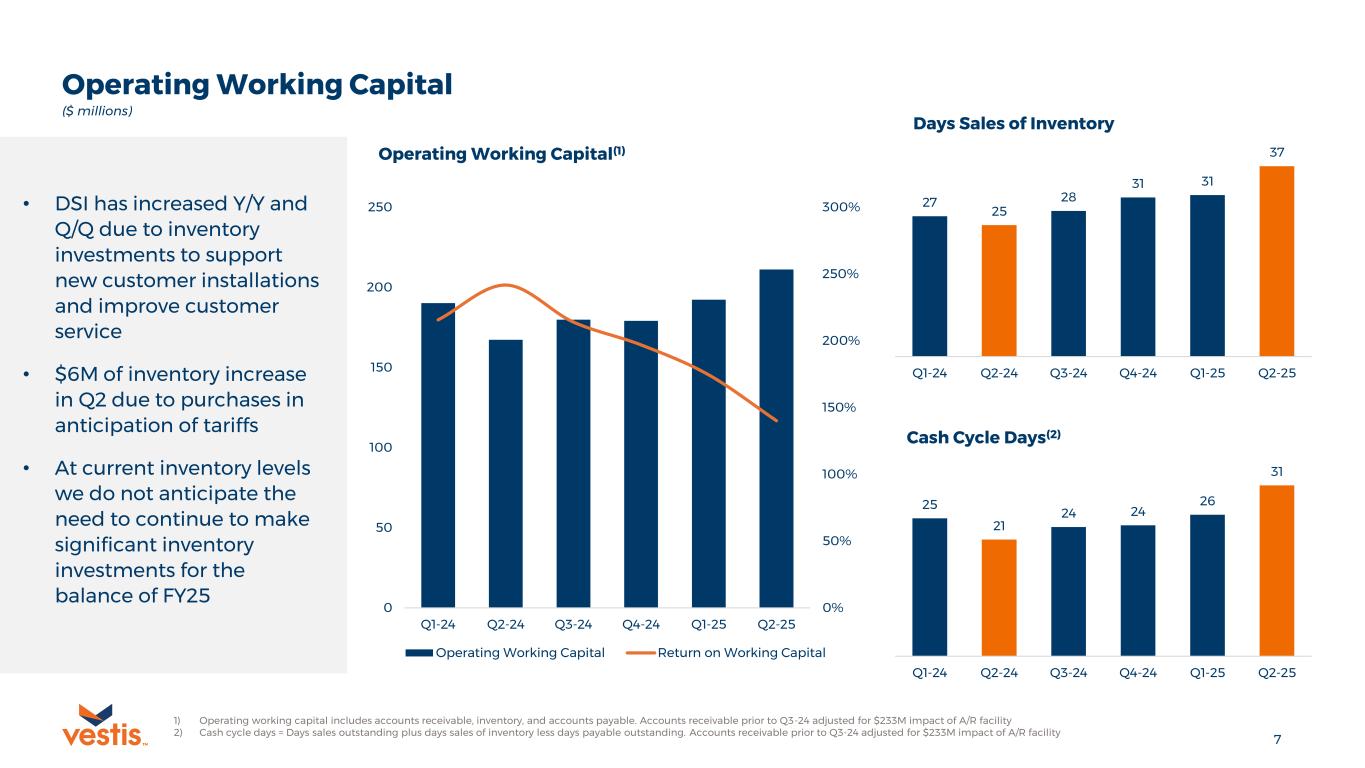
7TM Operating Working Capital • DSI has increased Y/Y and Q/Q due to inventory investments to support new customer installations and improve customer service • $6M of inventory increase in Q2 due to purchases in anticipation of tariffs • At current inventory levels we do not anticipate the need to continue to make significant inventory investments for the balance of FY25 1) Operating working capital includes accounts receivable, inventory, and accounts payable. Accounts receivable prior to Q3-24 adjusted for $233M impact of A/R facility 2) Cash cycle days = Days sales outstanding plus days sales of inventory less days payable outstanding. Accounts receivable prior to Q3-24 adjusted for $233M impact of A/R facility ($ millions) 0% 50% 100% 150% 200% 250% 300% 0 50 100 150 200 250 Q1-24 Q2-24 Q3-24 Q4-24 Q1-25 Q2-25 Operating Working Capital(1) Operating Working Capital Return on Working Capital 27 25 28 31 31 37 Q1-24 Q2-24 Q3-24 Q4-24 Q1-25 Q2-25 Days Sales of Inventory 25 21 24 24 26 31 Q1-24 Q2-24 Q3-24 Q4-24 Q1-25 Q2-25 Cash Cycle Days(2)
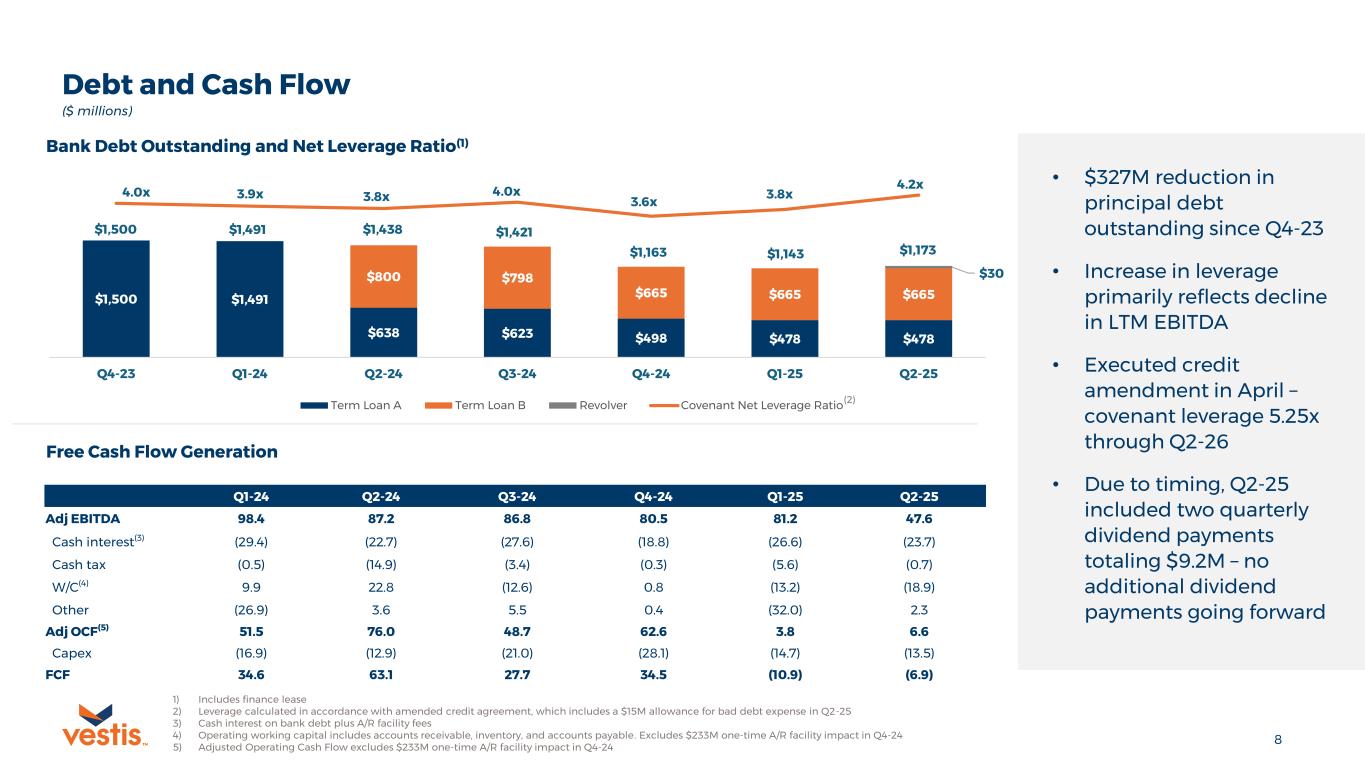
8TM $1,500 $1,491 $638 $623 $498 $478 $478 $800 $798 $665 $665 $665 $30 $1,500 $1,491 $1,438 $1,421 $1,163 $1,143 $1,173 4.0x 3.9x 3.8x 4.0x 3.6x 3.8x 4.2x Q4-23 Q1-24 Q2-24 Q3-24 Q4-24 Q1-25 Q2-25 Term Loan A Term Loan B Revolver Covenant Net Leverage Ratio Debt and Cash Flow • $327M reduction in principal debt outstanding since Q4-23 • Increase in leverage primarily reflects decline in LTM EBITDA • Executed credit amendment in April – covenant leverage 5.25x through Q2-26 • Due to timing, Q2-25 included two quarterly dividend payments totaling $9.2M – no additional dividend payments going forward 1) Includes finance lease 2) Leverage calculated in accordance with amended credit agreement, which includes a $15M allowance for bad debt expense in Q2-25 3) Cash interest on bank debt plus A/R facility fees 4) Operating working capital includes accounts receivable, inventory, and accounts payable. Excludes $233M one-time A/R facility impact in Q4-24 5) Adjusted Operating Cash Flow excludes $233M one-time A/R facility impact in Q4-24 Free Cash Flow Generation ($ millions) Q1-24 Q2-24 Q3-24 Q4-24 Q1-25 Q2-25 Adj EBITDA 98.4 87.2 86.8 80.5 81.2 47.6 Cash interest(3) (29.4) (22.7) (27.6) (18.8) (26.6) (23.7) Cash tax (0.5) (14.9) (3.4) (0.3) (5.6) (0.7) W/C(4) 9.9 22.8 (12.6) 0.8 (13.2) (18.9) Other (26.9) 3.6 5.5 0.4 (32.0) 2.3 Adj OCF(5) 51.5 76.0 48.7 62.6 3.8 6.6 Capex (16.9) (12.9) (21.0) (28.1) (14.7) (13.5) FCF 34.6 63.1 27.7 34.5 (10.9) (6.9) Bank Debt Outstanding and Net Leverage Ratio(1) (2)
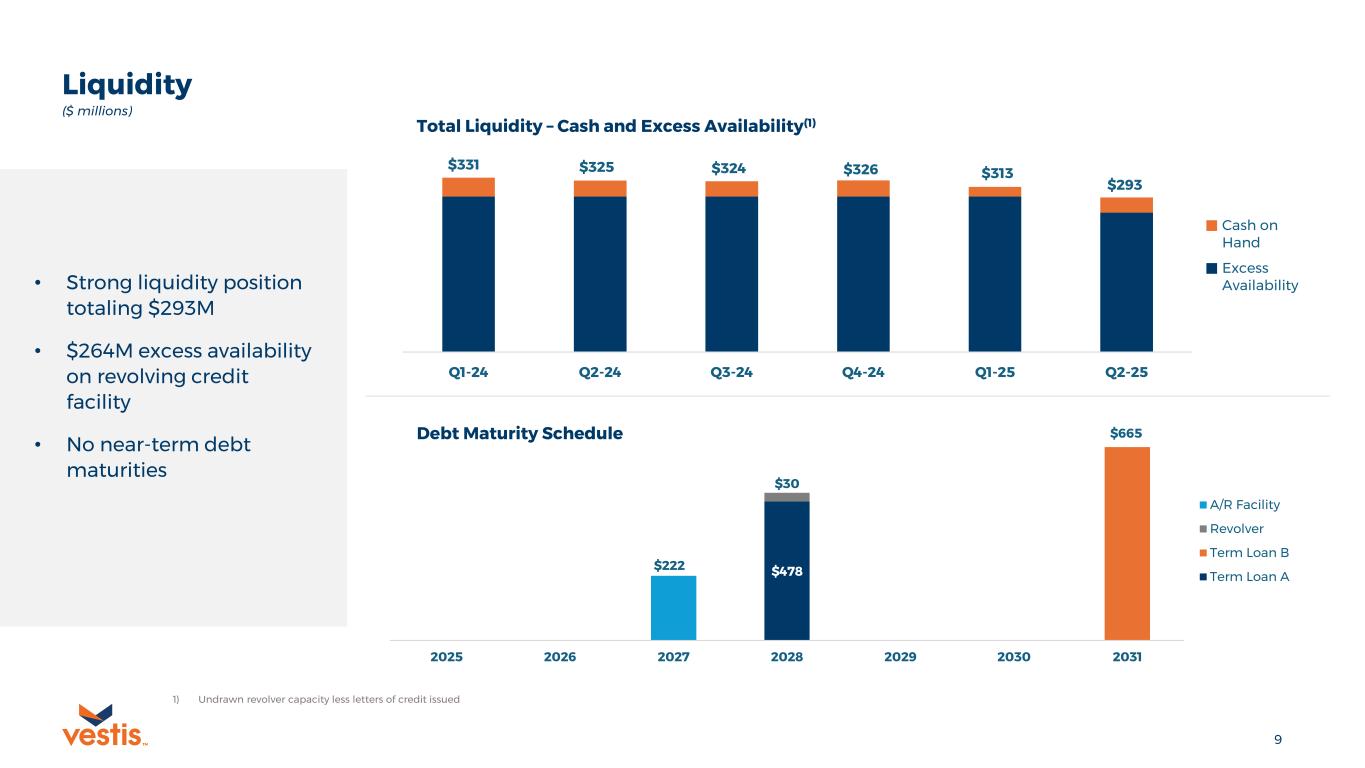
9TM $478 $665 $30 $222 2025 2026 2027 2028 2029 2030 2031 A/R Facility Revolver Term Loan B Term Loan A Liquidity • Strong liquidity position totaling $293M • $264M excess availability on revolving credit facility • No near-term debt maturities ($ millions) $331 $325 $324 $326 $313 $293 Q1-24 Q2-24 Q3-24 Q4-24 Q1-25 Q2-25 Cash on Hand Excess Availability Total Liquidity – Cash and Excess Availability(1) 1) Undrawn revolver capacity less letters of credit issued Debt Maturity Schedule
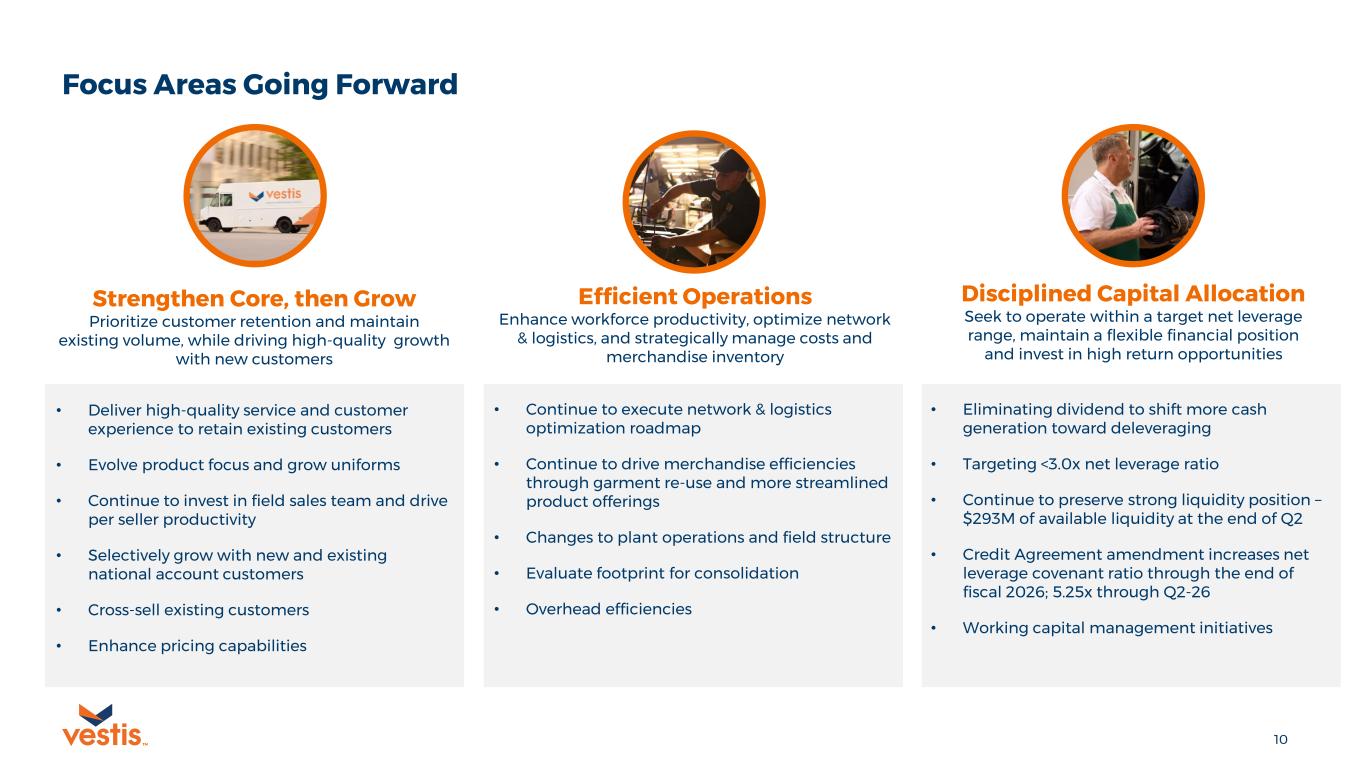
10TM Focus Areas Going Forward Strengthen Core, then Grow Prioritize customer retention and maintain existing volume, while driving high-quality growth with new customers • Deliver high-quality service and customer experience to retain existing customers • Evolve product focus and grow uniforms • Continue to invest in field sales team and drive per seller productivity • Selectively grow with new and existing national account customers • Cross-sell existing customers • Enhance pricing capabilities Efficient Operations Enhance workforce productivity, optimize network & logistics, and strategically manage costs and merchandise inventory Disciplined Capital Allocation Seek to operate within a target net leverage range, maintain a flexible financial position and invest in high return opportunities • Continue to execute network & logistics optimization roadmap • Continue to drive merchandise efficiencies through garment re-use and more streamlined product offerings • Changes to plant operations and field structure • Evaluate footprint for consolidation • Overhead efficiencies • Eliminating dividend to shift more cash generation toward deleveraging • Targeting <3.0x net leverage ratio • Continue to preserve strong liquidity position – $293M of available liquidity at the end of Q2 • Credit Agreement amendment increases net leverage covenant ratio through the end of fiscal 2026; 5.25x through Q2-26 • Working capital management initiatives

11TM Q&A

12TM APPENDIX
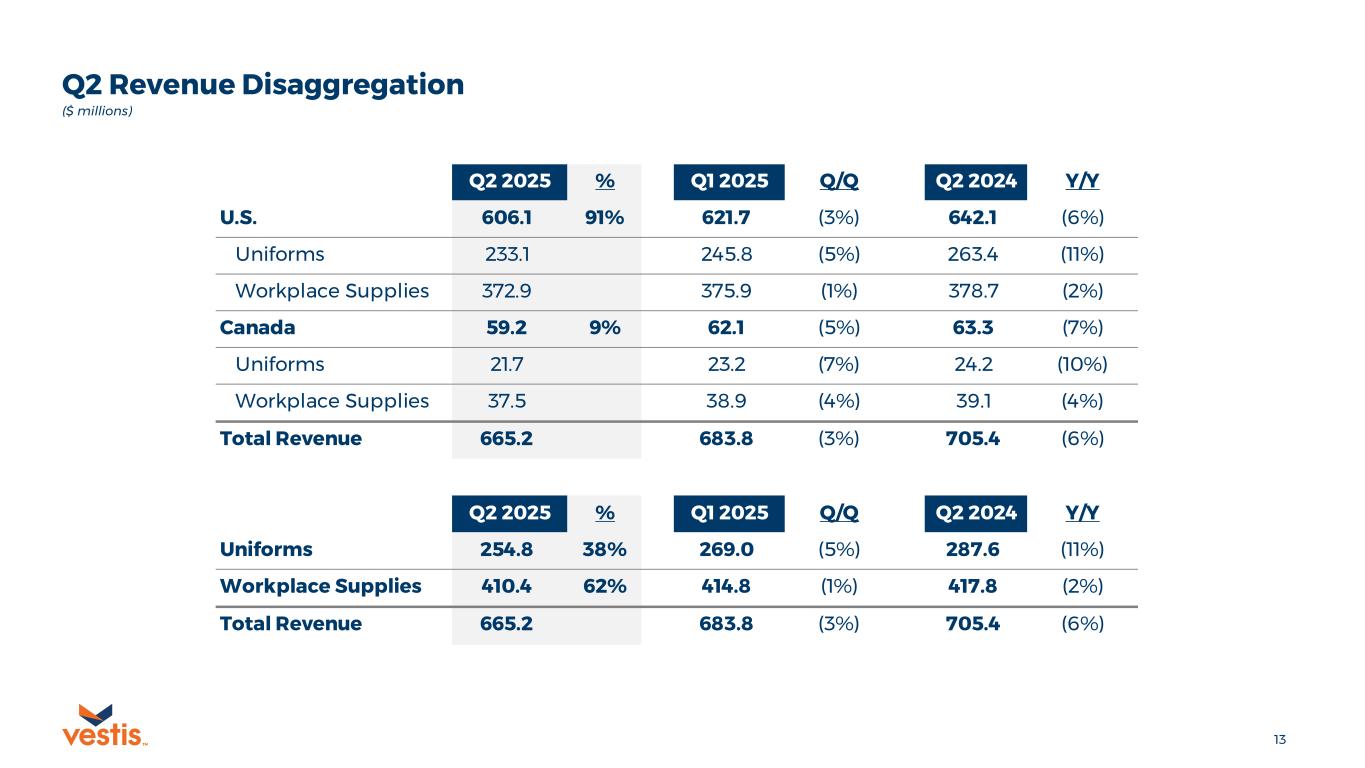
13TM Q2 Revenue Disaggregation ($ millions) Q2 2025 % Q1 2025 Q/Q Q2 2024 Y/Y U.S. 606.1 91% 621.7 (3%) 642.1 (6%) Uniforms 233.1 245.8 (5%) 263.4 (11%) Workplace Supplies 372.9 375.9 (1%) 378.7 (2%) Canada 59.2 9% 62.1 (5%) 63.3 (7%) Uniforms 21.7 23.2 (7%) 24.2 (10%) Workplace Supplies 37.5 38.9 (4%) 39.1 (4%) Total Revenue 665.2 683.8 (3%) 705.4 (6%) Q2 2025 % Q1 2025 Q/Q Q2 2024 Y/Y Uniforms 254.8 38% 269.0 (5%) 287.6 (11%) Workplace Supplies 410.4 62% 414.8 (1%) 417.8 (2%) Total Revenue 665.2 683.8 (3%) 705.4 (6%)
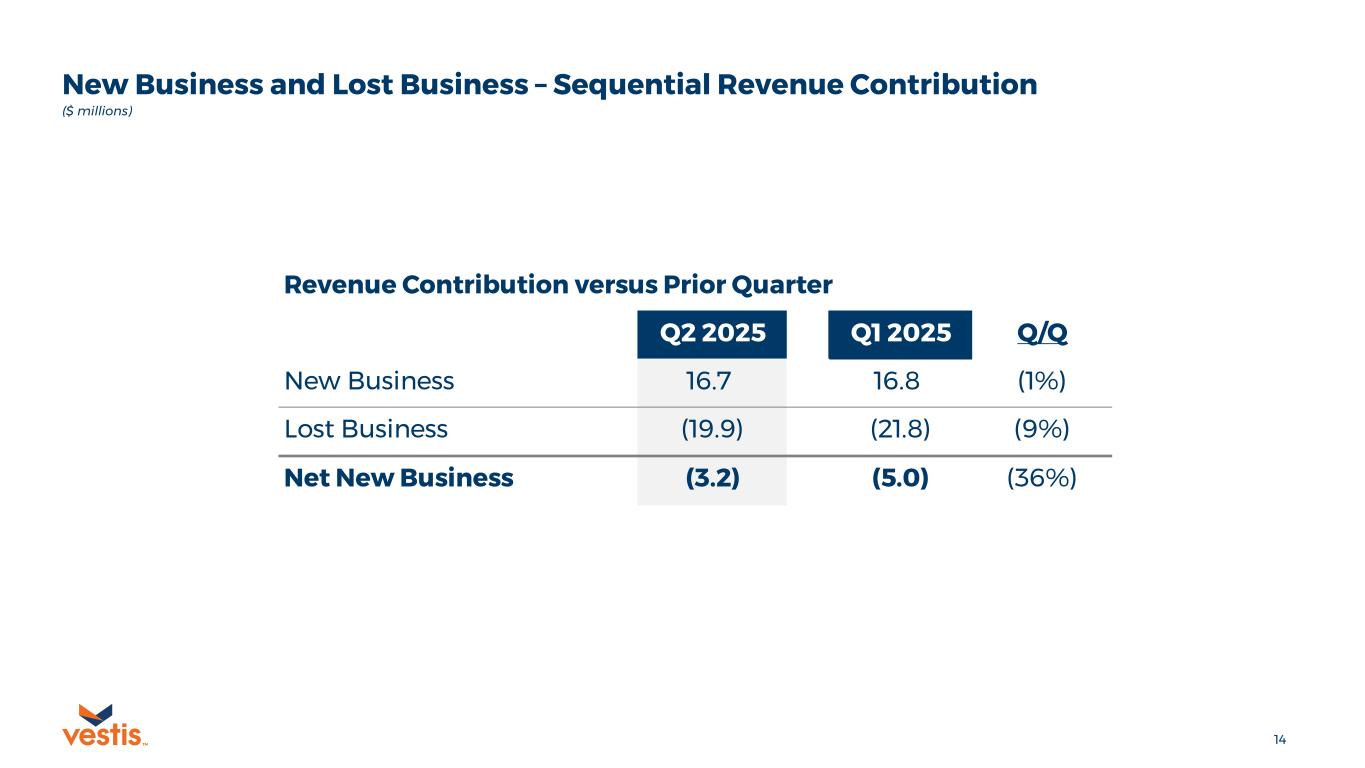
14TM New Business and Lost Business – Sequential Revenue Contribution ($ millions) Revenue Contribution versus Prior Quarter Q2 2025 Q1 2025 Q/Q New Business 16.7 16.8 (1%) Lost Business (19.9) (21.8) (9%) Net New Business (3.2) (5.0) (36%)
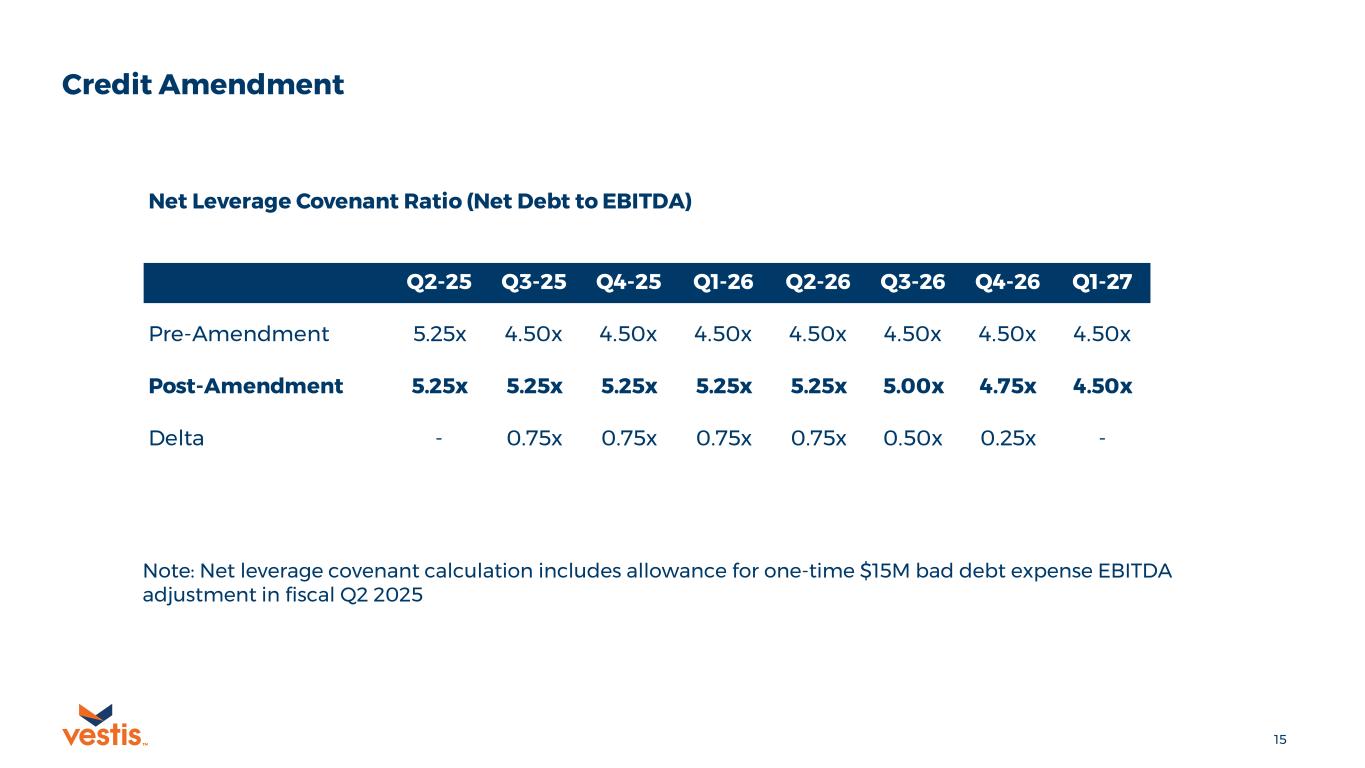
15TM Credit Amendment Note: Net leverage covenant calculation includes allowance for one-time $15M bad debt expense EBITDA adjustment in fiscal Q2 2025 Net Leverage Covenant Ratio (Net Debt to EBITDA) Q2-25 Q3-25 Q4-25 Q1-26 Q2-26 Q3-26 Q4-26 Q1-27 Pre-Amendment 5.25x 4.50x 4.50x 4.50x 4.50x 4.50x 4.50x 4.50x Post-Amendment 5.25x 5.25x 5.25x 5.25x 5.25x 5.00x 4.75x 4.50x Delta - 0.75x 0.75x 0.75x 0.75x 0.50x 0.25x -
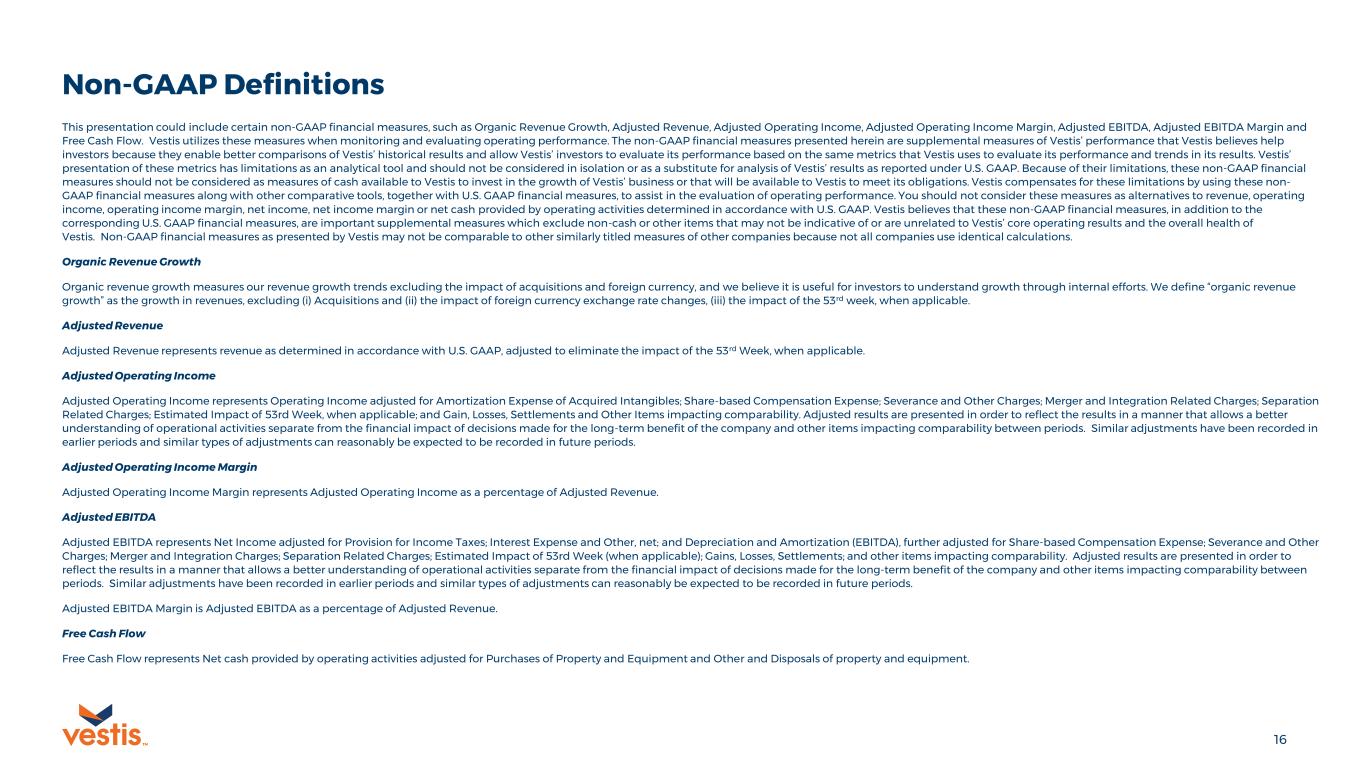
16TM Non-GAAP Definitions This presentation could include certain non-GAAP financial measures, such as Organic Revenue Growth, Adjusted Revenue, Adjusted Operating Income, Adjusted Operating Income Margin, Adjusted EBITDA, Adjusted EBITDA Margin and Free Cash Flow. Vestis utilizes these measures when monitoring and evaluating operating performance. The non-GAAP financial measures presented herein are supplemental measures of Vestis’ performance that Vestis believes help investors because they enable better comparisons of Vestis’ historical results and allow Vestis’ investors to evaluate its performance based on the same metrics that Vestis uses to evaluate its performance and trends in its results. Vestis’ presentation of these metrics has limitations as an analytical tool and should not be considered in isolation or as a substitute for analysis of Vestis’ results as reported under U.S. GAAP. Because of their limitations, these non-GAAP financial measures should not be considered as measures of cash available to Vestis to invest in the growth of Vestis’ business or that will be available to Vestis to meet its obligations. Vestis compensates for these limitations by using these non- GAAP financial measures along with other comparative tools, together with U.S. GAAP financial measures, to assist in the evaluation of operating performance. You should not consider these measures as alternatives to revenue, operating income, operating income margin, net income, net income margin or net cash provided by operating activities determined in accordance with U.S. GAAP. Vestis believes that these non-GAAP financial measures, in addition to the corresponding U.S. GAAP financial measures, are important supplemental measures which exclude non-cash or other items that may not be indicative of or are unrelated to Vestis’ core operating results and the overall health of Vestis. Non-GAAP financial measures as presented by Vestis may not be comparable to other similarly titled measures of other companies because not all companies use identical calculations. Organic Revenue Growth Organic revenue growth measures our revenue growth trends excluding the impact of acquisitions and foreign currency, and we believe it is useful for investors to understand growth through internal efforts. We define “organic revenue growth” as the growth in revenues, excluding (i) Acquisitions and (ii) the impact of foreign currency exchange rate changes, (iii) the impact of the 53rd week, when applicable. Adjusted Revenue Adjusted Revenue represents revenue as determined in accordance with U.S. GAAP, adjusted to eliminate the impact of the 53rd Week, when applicable. Adjusted Operating Income Adjusted Operating Income represents Operating Income adjusted for Amortization Expense of Acquired Intangibles; Share-based Compensation Expense; Severance and Other Charges; Merger and Integration Related Charges; Separation Related Charges; Estimated Impact of 53rd Week, when applicable; and Gain, Losses, Settlements and Other Items impacting comparability. Adjusted results are presented in order to reflect the results in a manner that allows a better understanding of operational activities separate from the financial impact of decisions made for the long-term benefit of the company and other items impacting comparability between periods. Similar adjustments have been recorded in earlier periods and similar types of adjustments can reasonably be expected to be recorded in future periods. Adjusted Operating Income Margin Adjusted Operating Income Margin represents Adjusted Operating Income as a percentage of Adjusted Revenue. Adjusted EBITDA Adjusted EBITDA represents Net Income adjusted for Provision for Income Taxes; Interest Expense and Other, net; and Depreciation and Amortization (EBITDA), further adjusted for Share-based Compensation Expense; Severance and Other Charges; Merger and Integration Charges; Separation Related Charges; Estimated Impact of 53rd Week (when applicable); Gains, Losses, Settlements; and other items impacting comparability. Adjusted results are presented in order to reflect the results in a manner that allows a better understanding of operational activities separate from the financial impact of decisions made for the long-term benefit of the company and other items impacting comparability between periods. Similar adjustments have been recorded in earlier periods and similar types of adjustments can reasonably be expected to be recorded in future periods. Adjusted EBITDA Margin is Adjusted EBITDA as a percentage of Adjusted Revenue. Free Cash Flow Free Cash Flow represents Net cash provided by operating activities adjusted for Purchases of Property and Equipment and Other and Disposals of property and equipment.
17TM Forward Looking Non-GAAP Information This presentation includes certain non-GAAP financial information that is forward-looking in nature, including without limitation third quarter fiscal 2025 revenue and adjusted EBITDA. Vestis believes that a quantitative reconciliation of such forward-looking information to the most comparable financial measure calculated and presented in accordance with GAAP cannot be made available without unreasonable efforts. A reconciliation of these non-GAAP financial measures would require Vestis to predict the timing and likelihood of among other things future acquisitions and divestitures, restructurings, asset impairments, other charges and other factors not within Vestis’ control. Neither these forward- looking measures, nor their probable significance, can be quantified with a reasonable degree of accuracy. Accordingly, the most directly comparable forward-looking GAAP measures are not provided. Forward-looking non-GAAP financial measures provided without the most directly comparable GAAP financial measures may vary materially from the corresponding GAAP financial measures. The estimates of third quarter fiscal 2025 revenue and adjusted EBITDA do not attempt to forecast currency fluctuations and, accordingly, reflect an assumption of constant currency.
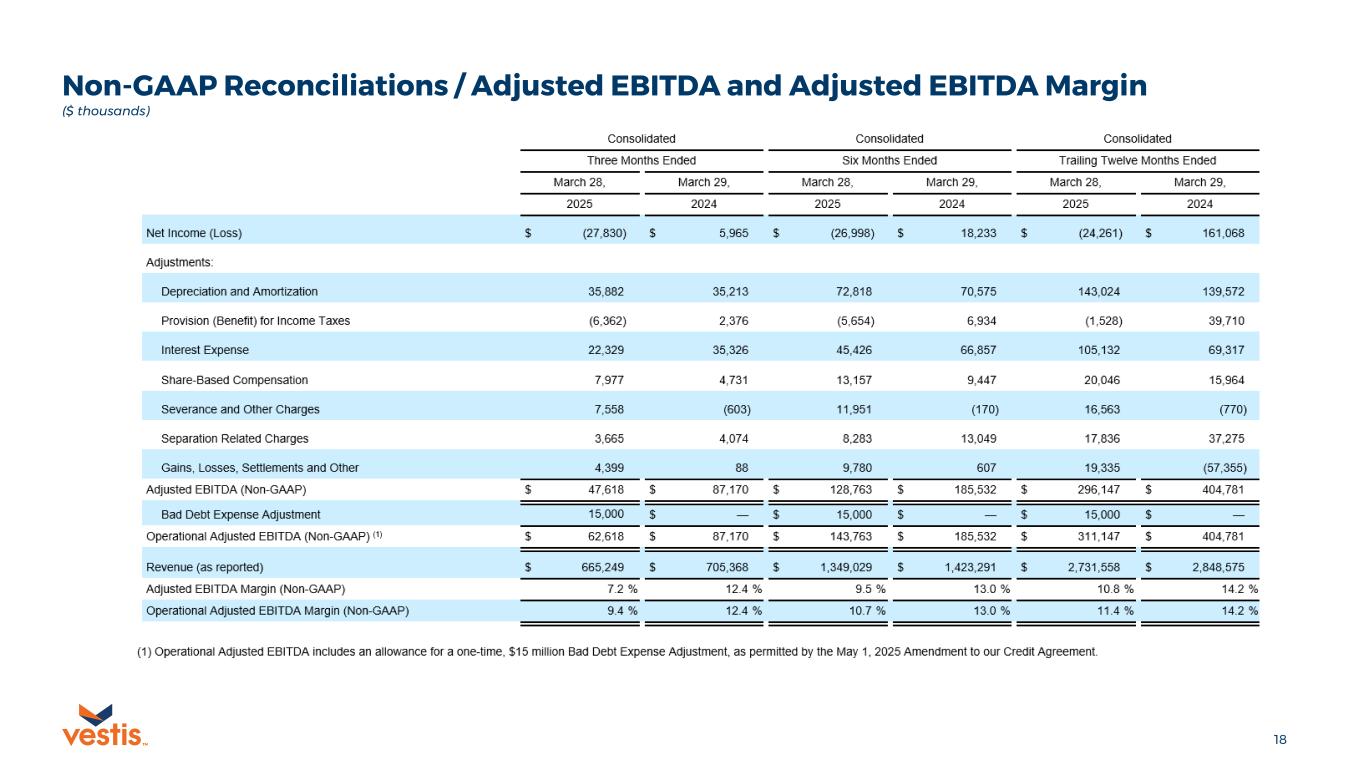
18TM Non-GAAP Reconciliations / Adjusted EBITDA and Adjusted EBITDA Margin ($ thousands)
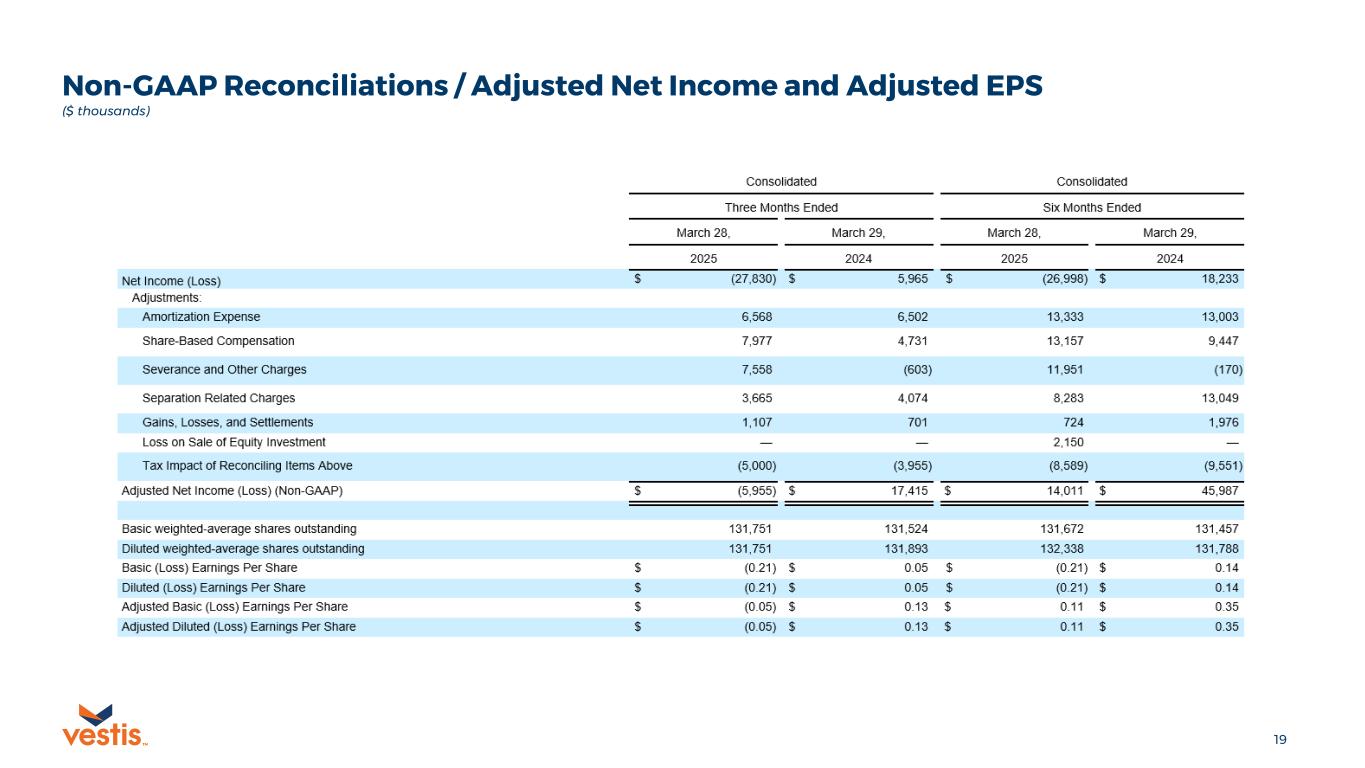
19TM Non-GAAP Reconciliations / Adjusted Net Income and Adjusted EPS ($ thousands)
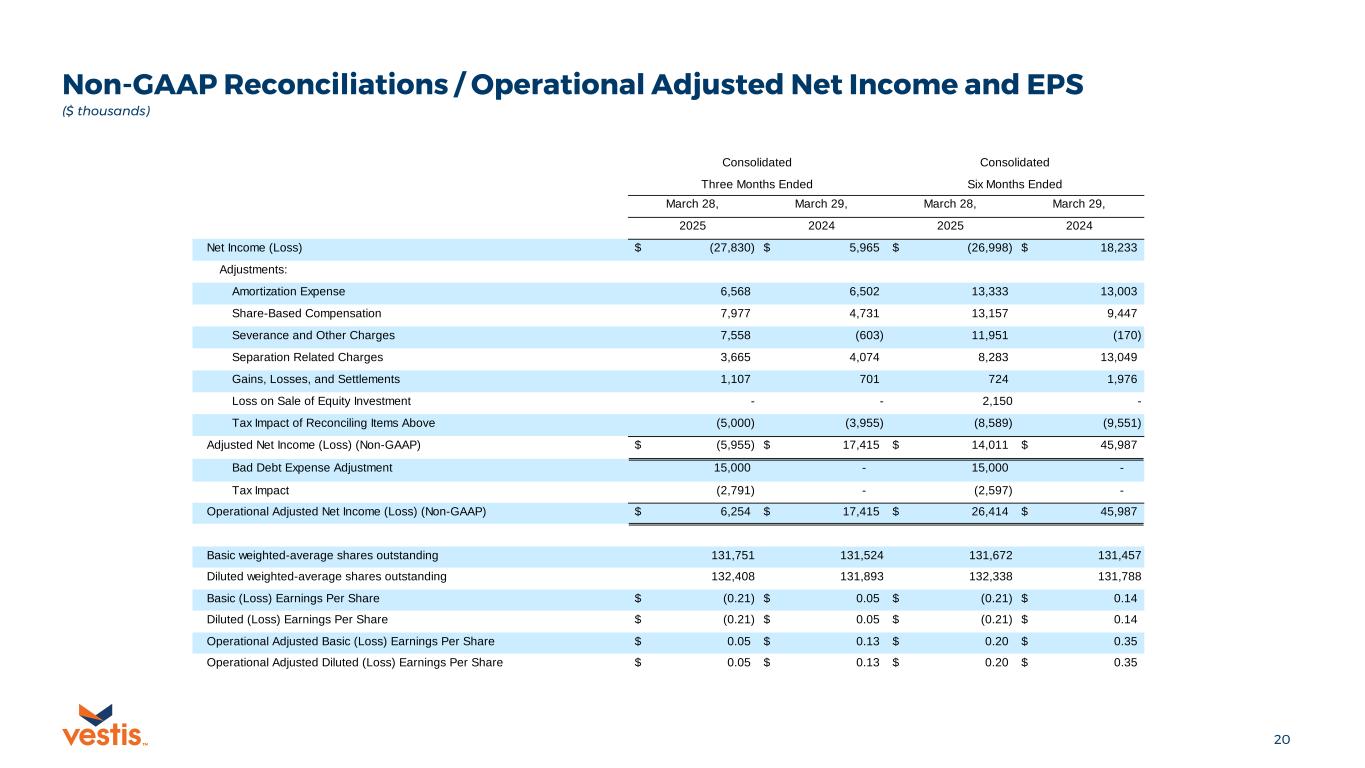
20TM Non-GAAP Reconciliations / Operational Adjusted Net Income and EPS ($ thousands) March 28, March 29, March 28, March 29, 2025 2024 2025 2024 (27,830)$ 5,965$ (26,998)$ 18,233$ 6,568 6,502 13,333 13,003 7,977 4,731 13,157 9,447 7,558 (603) 11,951 (170) 3,665 4,074 8,283 13,049 1,107 701 724 1,976 - - 2,150 - (5,000) (3,955) (8,589) (9,551) (5,955)$ 17,415$ 14,011$ 45,987$ 15,000 - 15,000 - (2,791) - (2,597) - 6,254$ 17,415$ 26,414$ 45,987$ 131,751 131,524 131,672 131,457 132,408 131,893 132,338 131,788 (0.21)$ 0.05$ (0.21)$ 0.14$ (0.21)$ 0.05$ (0.21)$ 0.14$ 0.05$ 0.13$ 0.20$ 0.35$ 0.05$ 0.13$ 0.20$ 0.35$ Diluted (Loss) Earnings Per Share Operational Adjusted Basic (Loss) Earnings Per Share Operational Adjusted Diluted (Loss) Earnings Per Share Separation Related Charges Gains, Losses, and Settlements Loss on Sale of Equity Investment Tax Impact of Reconciling Items Above Adjusted Net Income (Loss) (Non-GAAP) Bad Debt Expense Adjustment Operational Adjusted Net Income (Loss) (Non-GAAP) Tax Impact Basic weighted-average shares outstanding Diluted weighted-average shares outstanding Basic (Loss) Earnings Per Share Net Income (Loss) Adjustments: Amortization Expense Share-Based Compensation Severance and Other Charges Consolidated Consolidated Three Months Ended Six Months Ended
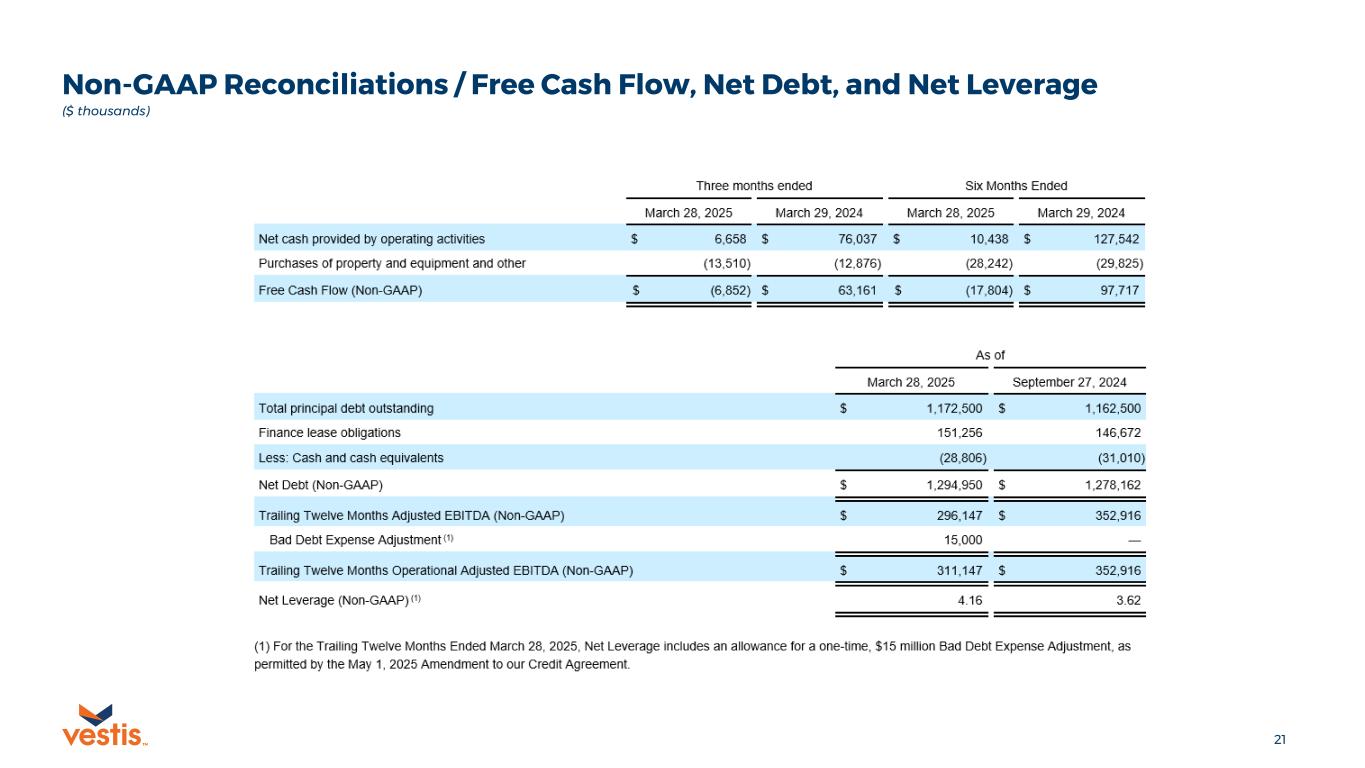
21TM Non-GAAP Reconciliations / Free Cash Flow, Net Debt, and Net Leverage ($ thousands)