EX-99.2
Published on August 5, 2025

Third Quarter 2025 Results August 6, 2025
Non-GAAP Measures While we report our financial results in accordance with U.S. GAAP, in this presentation and the associated remarks, we also make reference to certain non-GAAP measures, including: Adjusted EBITDA, Adjusted EBITDA Margin, Free Cash Flow, Net Debt, Net Leverage Ratio, Trailing Twelve Months Covenant Adjusted EBITDA, and Return on Working Capital. We include these non-GAAP financial measures to assist investors in the evaluation of our operating performance, and we believe that presentation of these measures also helps investors because the measures enable better comparisons of our historical results and allow investors to evaluate our performance based on the same metrics that we use to evaluate our performance and trends in our results. These measures should not be considered in isolation or as a substitute for our results as reported under U.S. GAAP, and non-GAAP financial measures as presented by us may not be comparable to other similarly titled measures of other companies because not all companies use identical calculations. These non-GAAP measures are explained and reconciled at the end of this presentation. This presentation and the remarks made during the associated conference call are integrally related and are intended to be presented and understood together. Forward-Looking Statements This presentation contains “forward-looking statements” within the meaning of the securities laws. All statements that reflect our expectations, assumptions or projections about the future, other than statements of historical fact, are forward-looking statements, including, without limitation, forecasts relating to discussions of future operations and financial performance and statements regarding our strategy for growth, future product development, regulatory approvals, competitive position and expenditures. In some cases, forward-looking statements can be identified by words such as “potential,” “outlook,” “guidance,” “anticipate,” “continue,” “estimate,” “expect,” “will,” and “believe,” and other words and terms of similar meaning or the negative versions of such words. Examples of forward-looking statements in this release include, but are not limited to, statements regarding: the potential effects of our comprehensive actions to enhance both our commercial and operational processes, and our expectations regarding our fourth quarter 2025 performance outlook. These forward-looking statements are subject to risks and uncertainties that may change at any time, and actual results or outcomes may differ materially from those that we expected. Forward-looking statements are not guarantees of future performance and are subject to risks, uncertainties, and changes in circumstances that are difficult to predict including, but not limited to: unfavorable macroeconomic conditions including inflationary pressures and higher interest rates; the failure to retain current customers, renew existing customer contracts and obtain new customer contracts, which could result in continued stock volatility and potential future goodwill impairment charges; competition in our industry; our ability to comply with certain financial ratios, tests and covenants in our credit agreement, including the Net Leverage Ratio; our significant indebtedness and ability to meet debt obligations and our reliance on an accounts receivable securitization facility; increases in fuel and energy costs and other supply chain challenges and disruptions, including as a result of ongoing military conflicts in Ukraine and the Middle East; implementation of new or increased tariffs and ongoing changes in U.S. and foreign government trade policies, including potential modifications to existing trade agreements and retaliatory measures by foreign governments; increased operating costs and obstacles to cost recovery due to the pricing and cancellation terms of our support services contracts; a determination by our customers to reduce their outsourcing or use of preferred vendors; the outcome of legal proceedings to which we are or may become subject; risks associated with suppliers from whom our products are sourced; challenge of contracts by our customers; currency risks and other risks associated with international operations, including compliance with a broad range of laws and regulations, including the United States Foreign Corrupt Practices Act; increases in labor costs or inability to hire and retain key or sufficient qualified personnel; continued or further unionization of our workforce; our expansion strategy and our ability to successfully integrate the businesses we acquire and costs and timing related thereto; natural disasters, global calamities, climate change, pandemics, and other adverse incidents; liability resulting from our participation in multiemployer-defined benefit pension plans; liability associated with noncompliance with applicable law or other governmental regulations; laws and governmental regulations including those relating to the environment, wage and hour and government contracting; unanticipated changes in tax law; new interpretations of or changes in the enforcement of the government regulatory framework; a cybersecurity incident or other disruptions in the availability of our computer systems or privacy breaches; stakeholder expectations relating to environmental, social and governance (“ESG”) considerations which may expose us to liabilities and other adverse effects on our business; any failure by Aramark to perform its obligations under the various separation agreements entered into in connection with the separation; and a determination by the IRS that the distribution or certain related transactions are taxable. The above list of factors is not exhaustive or necessarily in order of importance. For additional information on identifying factors that may cause actual results to vary materially from those stated in forward-looking statements, see the Company’s filings with the Securities and Exchange Commission (“SEC”), including “Item 1A-Risk Factors” in the Company’s most recent Annual Report on Form 10-K and in “Item 1A-Risk Factors” of Part II in subsequently-filed Quarterly Reports on Form 10-Q, which are available on the SEC’s website at www.sec.gov. Any forward-looking statement speaks only as of the date on which it is made, and we assume no obligation to update or revise such statement, whether as a result of new information, future events or otherwise, except as required by applicable law. Notes to Investors ©2025 Vestis. All rights reserved. 2
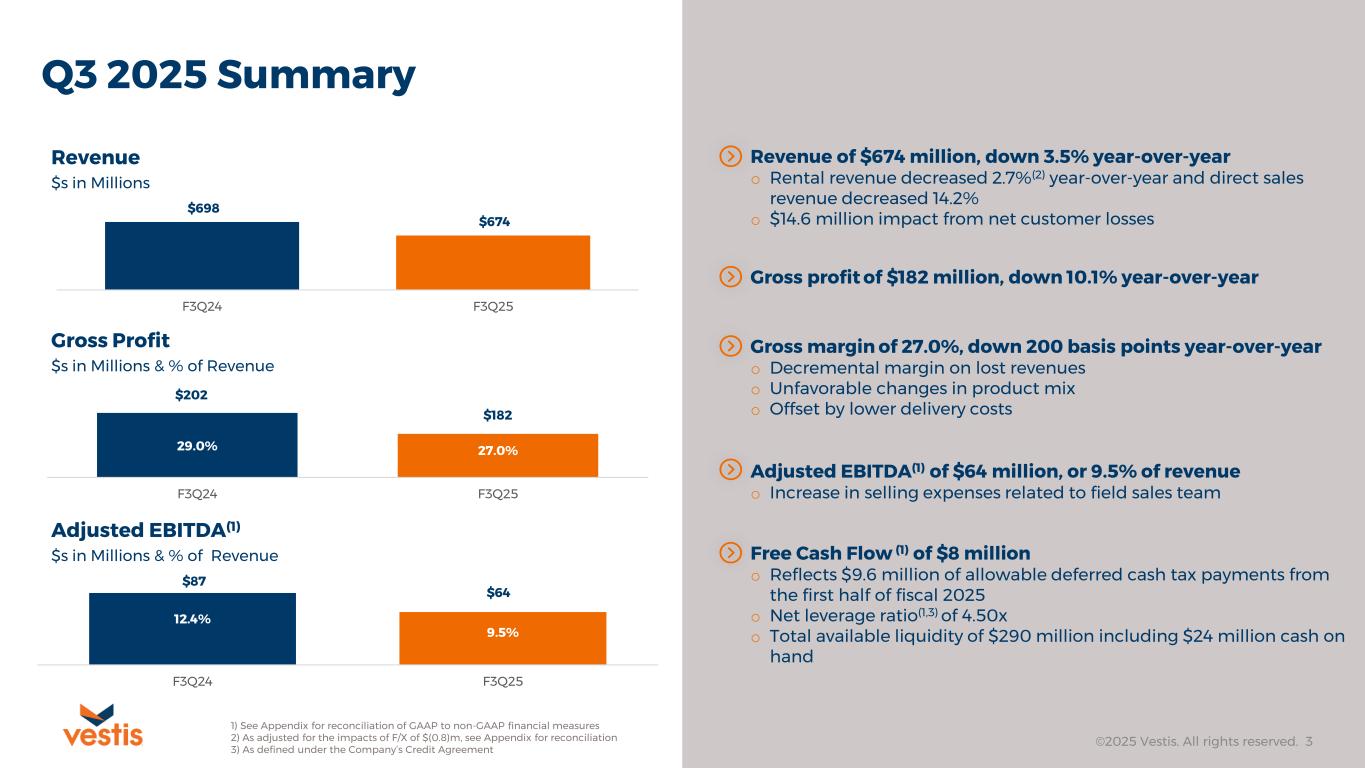
Q3 2025 Summary ©2025 Vestis. All rights reserved. 3 Revenue $s in Millions $698 $674 F3Q24 F3Q25 $202 $182 29.0% 27.0% F3Q24 F3Q25 Gross Profit $s in Millions & % of Revenue $87 $64 12.4% 9.5% F3Q24 F3Q25 Adjusted EBITDA(1) $s in Millions & % of Revenue Revenue of $674 million, down 3.5% year-over-year o Rental revenue decreased 2.7%(2) year-over-year and direct sales revenue decreased 14.2% o $14.6 million impact from net customer losses Gross profit of $182 million, down 10.1% year-over-year 1) See Appendix for reconciliation of GAAP to non-GAAP financial measures 2) As adjusted for the impacts of F/X of $(0.8)m, see Appendix for reconciliation 3) As defined under the Company’s Credit Agreement Gross margin of 27.0%, down 200 basis points year-over-year o Decremental margin on lost revenues o Unfavorable changes in product mix o Offset by lower delivery costs Adjusted EBITDA(1) of $64 million, or 9.5% of revenue o Increase in selling expenses related to field sales team Free Cash Flow (1) of $8 million o Reflects $9.6 million of allowable deferred cash tax payments from the first half of fiscal 2025 o Net leverage ratio(1,3) of 4.50x o Total available liquidity of $290 million including $24 million cash on hand
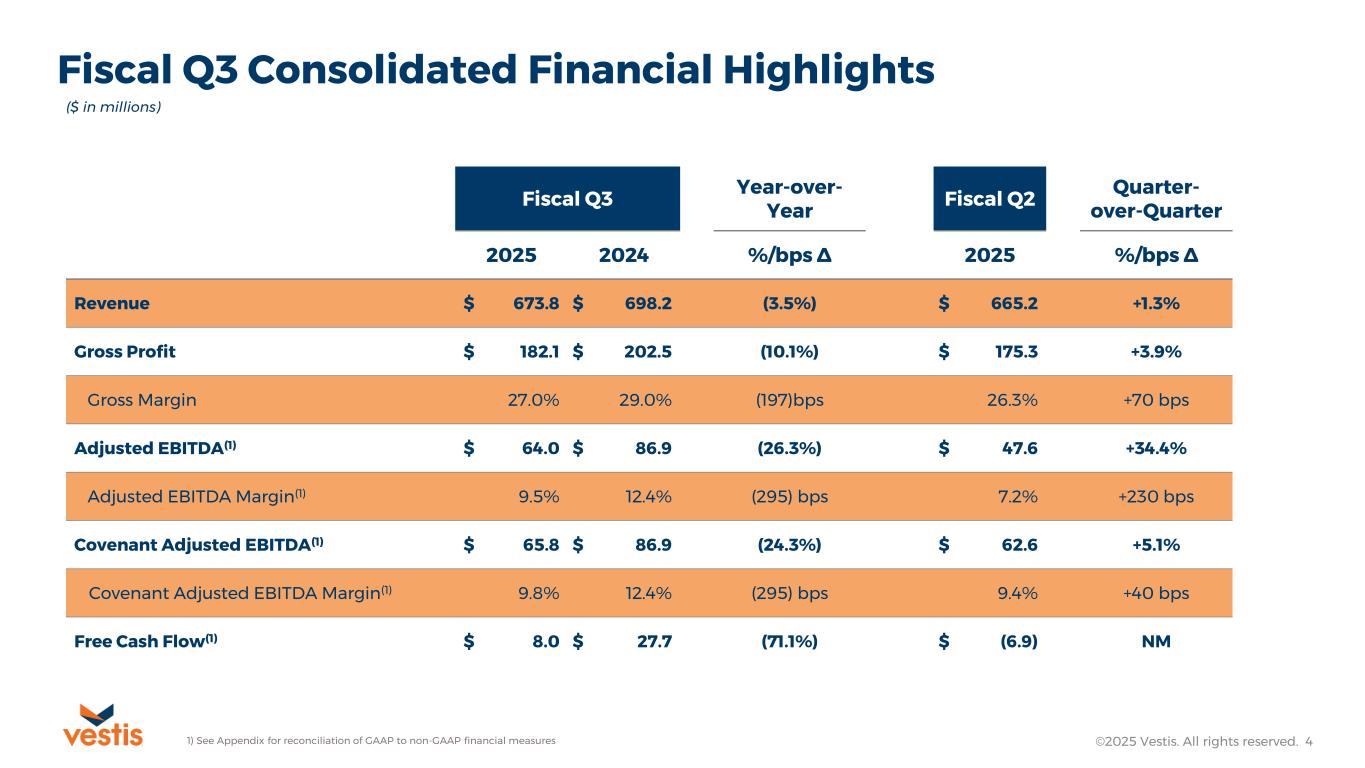
Fiscal Q3 Consolidated Financial Highlights ©2025 Vestis. All rights reserved. 4 Fiscal Q3 Year-over- Year Fiscal Q2 Quarter- over-Quarter 2025 2024 %/bps ∆ 2025 %/bps ∆ Revenue $ 673.8 $ 698.2 (3.5%) $ 665.2 +1.3% Gross Profit $ 182.1 $ 202.5 (10.1%) $ 175.3 +3.9% Gross Margin 27.0% 29.0% (197)bps 26.3% +70 bps Adjusted EBITDA(1) $ 64.0 $ 86.9 (26.3%) $ 47.6 +34.4% Adjusted EBITDA Margin(1) 9.5% 12.4% (295) bps 7.2% +230 bps Covenant Adjusted EBITDA(1) $ 65.8 $ 86.9 (24.3%) $ 62.6 +5.1% Covenant Adjusted EBITDA Margin(1) 9.8% 12.4% (295) bps 9.4% +40 bps Free Cash Flow(1) $ 8.0 $ 27.7 (71.1%) $ (6.9) NM 1) See Appendix for reconciliation of GAAP to non-GAAP financial measures ($ in millions)
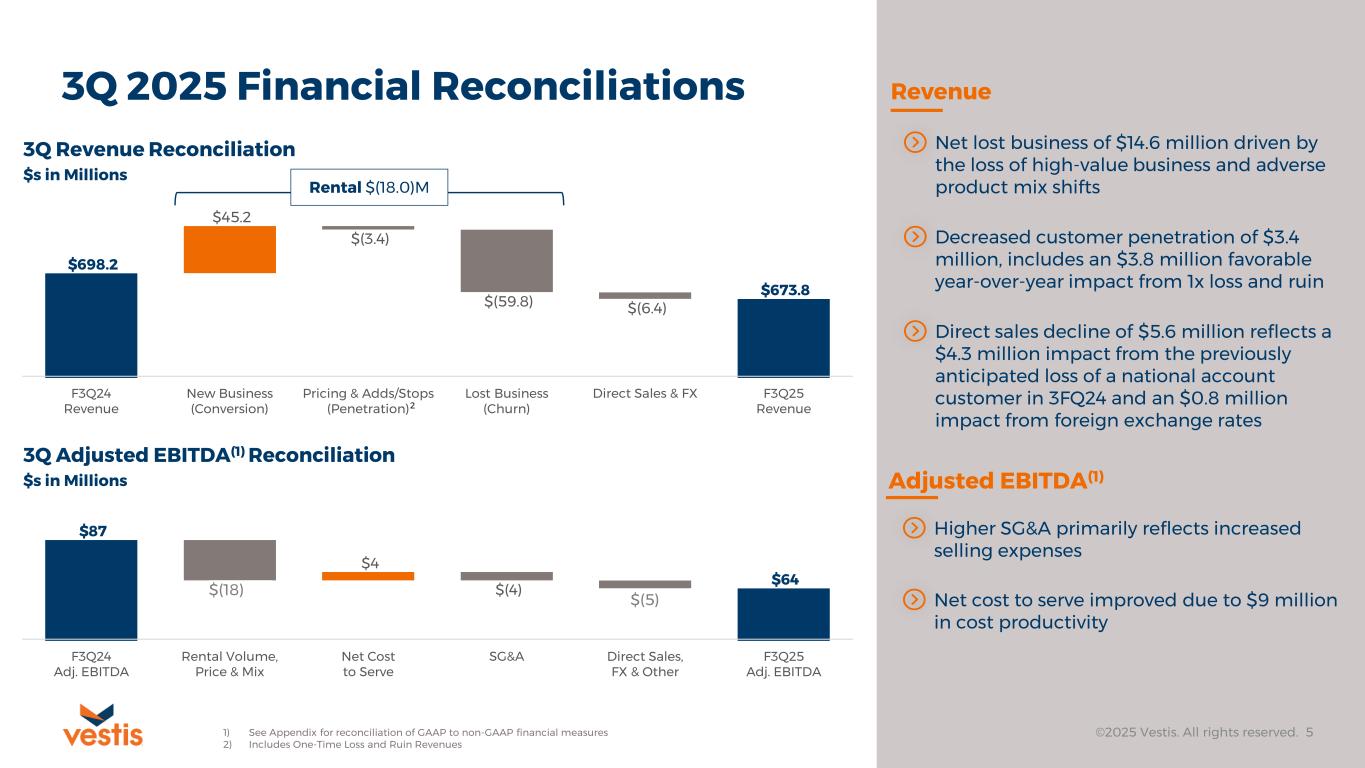
$45.2 $(3.4) $(59.8) $(6.4) $698.2 $673.8 F3Q24 Revenue New Business (Conversion) Pricing & Adds/Stops (Penetration) Lost Business (Churn) Direct Sales & FX F3Q25 Revenue 3Q 2025 Financial Reconciliations ©2025 Vestis. All rights reserved. 5 Net lost business of $14.6 million driven by the loss of high-value business and adverse product mix shiftsRental $(18.0)M 3Q Revenue Reconciliation $s in Millions 3Q Adjusted EBITDA(1) Reconciliation $s in Millions Decreased customer penetration of $3.4 million, includes an $3.8 million favorable year-over-year impact from 1x loss and ruin Direct sales decline of $5.6 million reflects a $4.3 million impact from the previously anticipated loss of a national account customer in 3FQ24 and an $0.8 million impact from foreign exchange rates Higher SG&A primarily reflects increased selling expenses Net cost to serve improved due to $9 million in cost productivity Adjusted EBITDA(1) Revenue 1) See Appendix for reconciliation of GAAP to non-GAAP financial measures 2) Includes One-Time Loss and Ruin Revenues 2 $(19) $4 $(4) $(4) $87 $64 F3Q24 Adj. EBITDA Rental Volume, Price & Mix Net Cost to Serve SG&A Direct Sales, FX & Other F3Q25 Adj. EBITDA $(18) $(5)
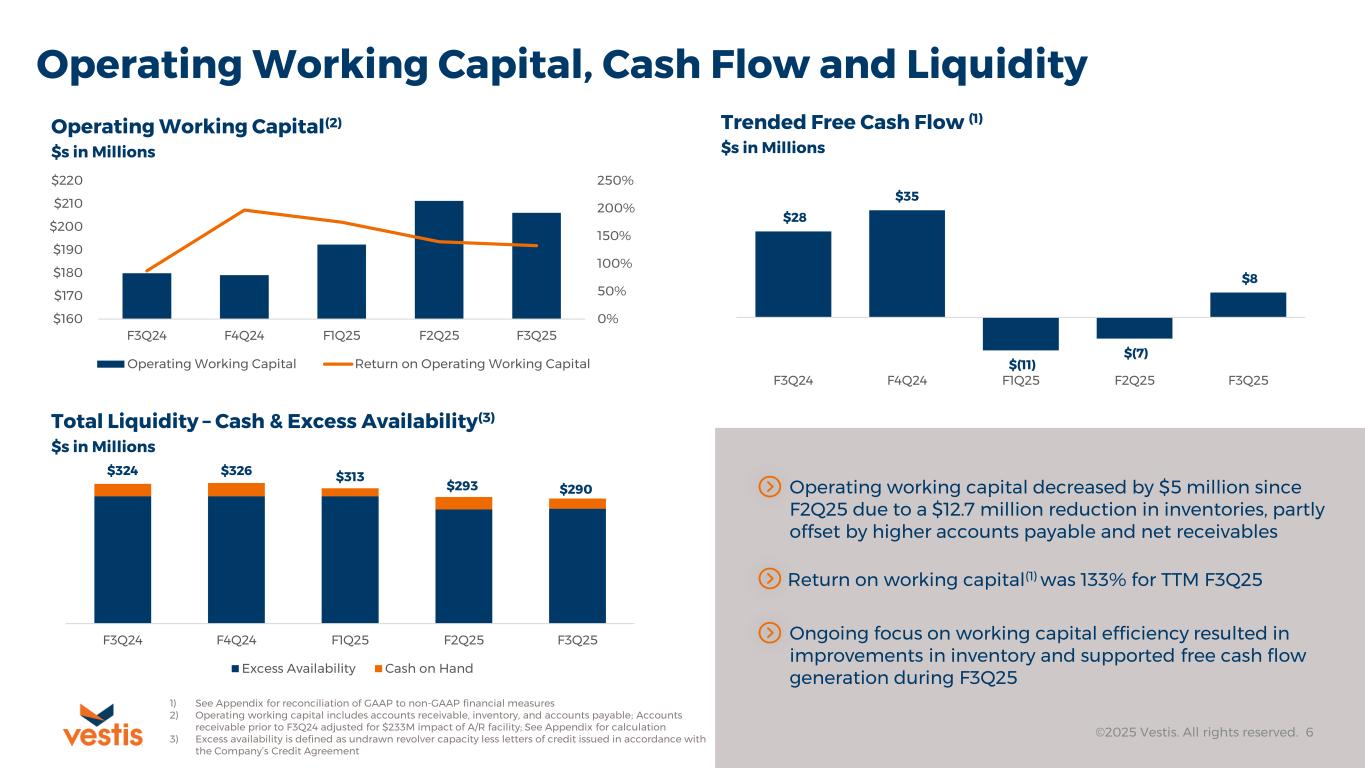
Operating Working Capital, Cash Flow and Liquidity ©2025 Vestis. All rights reserved. 6 Operating Working Capital(2) $s in Millions Total Liquidity – Cash & Excess Availability(3) $s in Millions Trended Free Cash Flow (1) $s in Millions Ongoing focus on working capital efficiency resulted in improvements in inventory and supported free cash flow generation during F3Q25 Return on working capital(1) was 133% for TTM F3Q25 Operating working capital decreased by $5 million since F2Q25 due to a $12.7 million reduction in inventories, partly offset by higher accounts payable and net receivables 1) See Appendix for reconciliation of GAAP to non-GAAP financial measures 2) Operating working capital includes accounts receivable, inventory, and accounts payable; Accounts receivable prior to F3Q24 adjusted for $233M impact of A/R facility; See Appendix for calculation 3) Excess availability is defined as undrawn revolver capacity less letters of credit issued in accordance with the Company’s Credit Agreement $28 $35 $(11) $(7) $8 F3Q24 F4Q24 F1Q25 F2Q25 F3Q25 $324 $326 $313 $293 $290 F3Q24 F4Q24 F1Q25 F2Q25 F3Q25 Excess Availability Cash on Hand 0% 50% 100% 150% 200% 250% $160 $170 $180 $190 $200 $210 $220 F3Q24 F4Q24 F1Q25 F2Q25 F3Q25 Operating Working Capital Return on Operating Working Capital
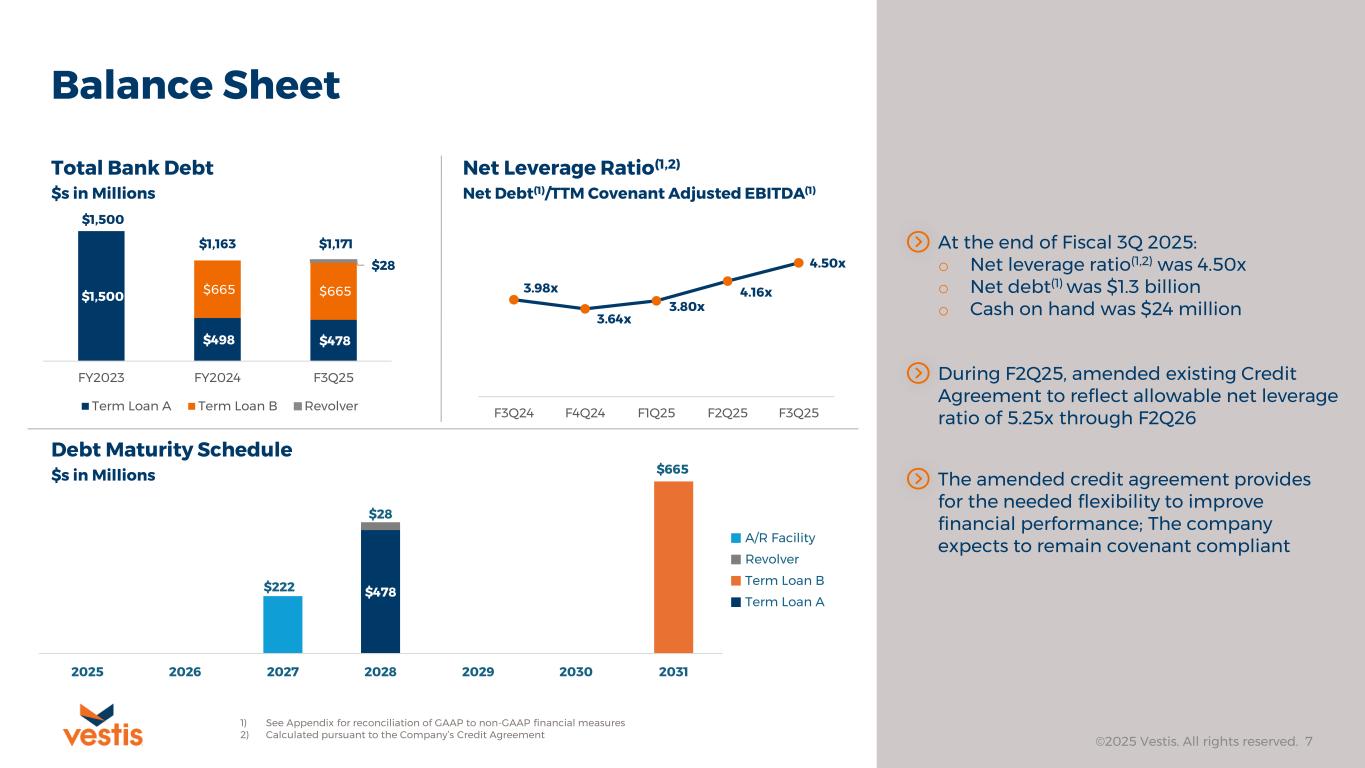
Balance Sheet ©2025 Vestis. All rights reserved. 7 Total Bank Debt $s in Millions Debt Maturity Schedule $s in Millions Net Leverage Ratio(1,2) Net Debt(1)/TTM Covenant Adjusted EBITDA(1) $478 $665 $28 $222 2025 2026 2027 2028 2029 2030 2031 A/R Facility Revolver Term Loan B Term Loan A $1,500 $498 $478 $665 $665 $28 FY2023 FY2024 F3Q25 Term Loan A Term Loan B Revolver $1,500 $1,163 $1,171 1) See Appendix for reconciliation of GAAP to non-GAAP financial measures 2) Calculated pursuant to the Company’s Credit Agreement The amended credit agreement provides for the needed flexibility to improve financial performance; The company expects to remain covenant compliant During F2Q25, amended existing Credit Agreement to reflect allowable net leverage ratio of 5.25x through F2Q26 3.98x 3.64x 3.80x 4.16x 4.50x F3Q24 F4Q24 F1Q25 F2Q25 F3Q25 At the end of Fiscal 3Q 2025: o Net leverage ratio(1,2) was 4.50x o Net debt(1) was $1.3 billion o Cash on hand was $24 million
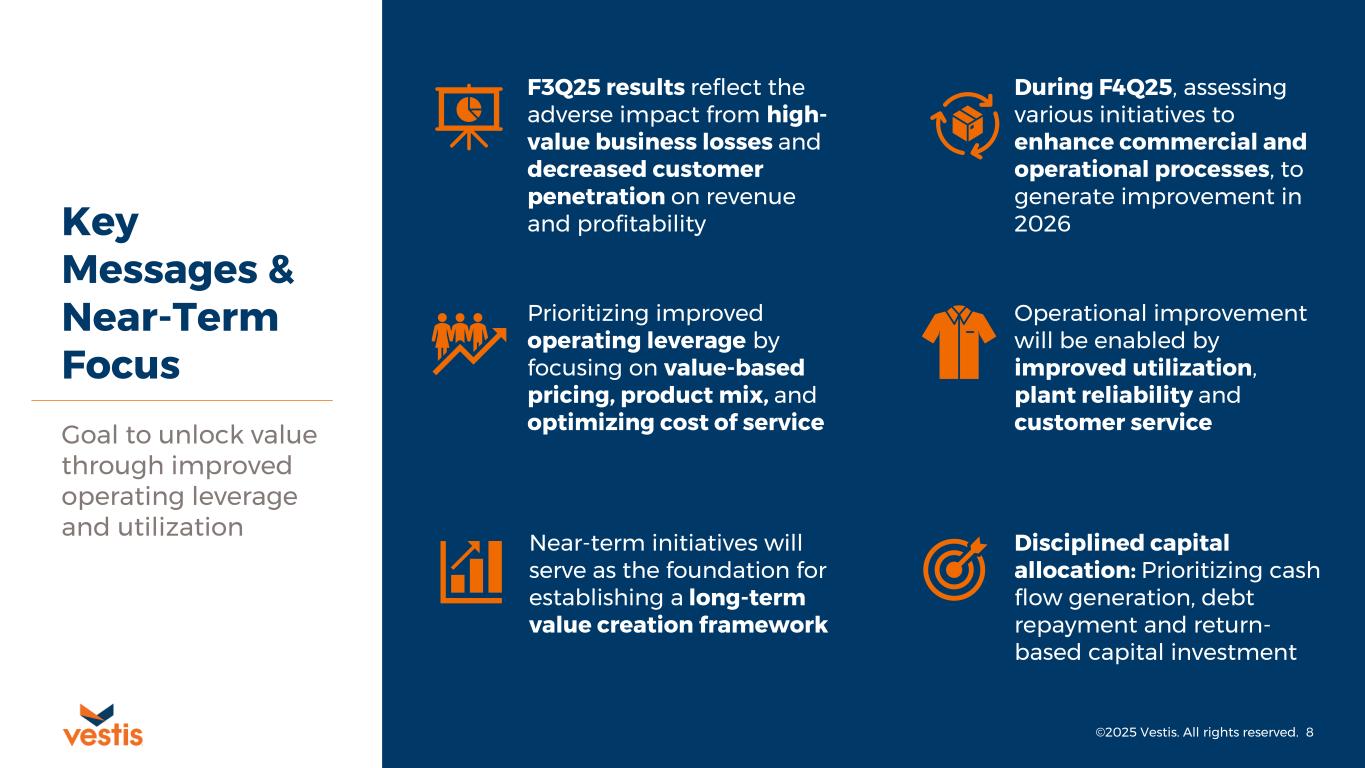
Key Messages & Near-Term Focus Goal to unlock value through improved operating leverage and utilization ©2025 Vestis. All rights reserved. 8 During F4Q25, assessing various initiatives to enhance commercial and operational processes, to generate improvement in 2026 Near-term initiatives will serve as the foundation for establishing a long-term value creation framework Operational improvement will be enabled by improved utilization, plant reliability and customer service Disciplined capital allocation: Prioritizing cash flow generation, debt repayment and return- based capital investment F3Q25 results reflect the adverse impact from high- value business losses and decreased customer penetration on revenue and profitability Prioritizing improved operating leverage by focusing on value-based pricing, product mix, and optimizing cost of service
©2025 Vestis. All rights reserved. 9 Q&A

Appendix
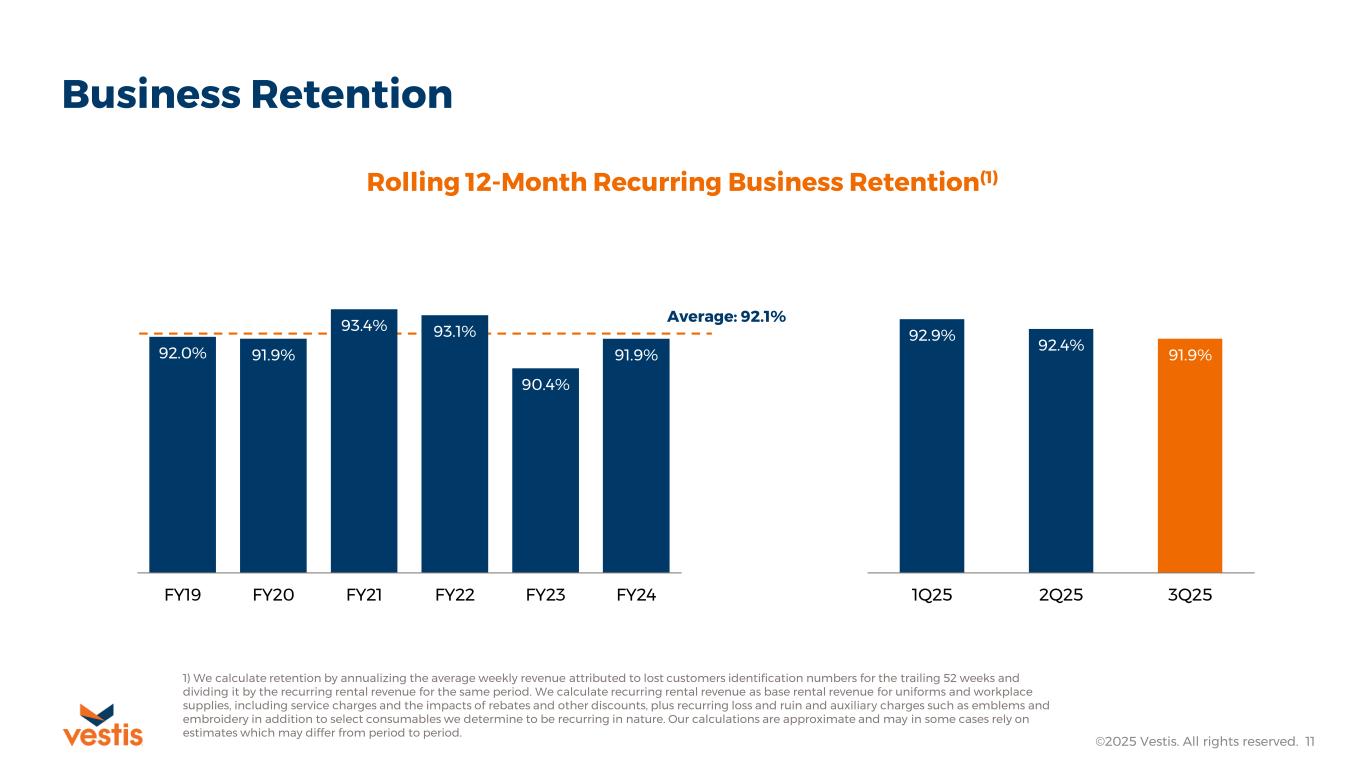
Business Retention ©2025 Vestis. All rights reserved. 11 92.0% 91.9% 93.4% 93.1% 90.4% 91.9% FY19 FY20 FY21 FY22 FY23 FY24 Rolling 12-Month Recurring Business Retention(1) 92.9% 92.4% 91.9% 1Q25 2Q25 3Q25 Average: 92.1% 1) We calculate retention by annualizing the average weekly revenue attributed to lost customers identification numbers for the trailing 52 weeks and dividing it by the recurring rental revenue for the same period. We calculate recurring rental revenue as base rental revenue for uniforms and workplace supplies, including service charges and the impacts of rebates and other discounts, plus recurring loss and ruin and auxiliary charges such as emblems and embroidery in addition to select consumables we determine to be recurring in nature. Our calculations are approximate and may in some cases rely on estimates which may differ from period to period.
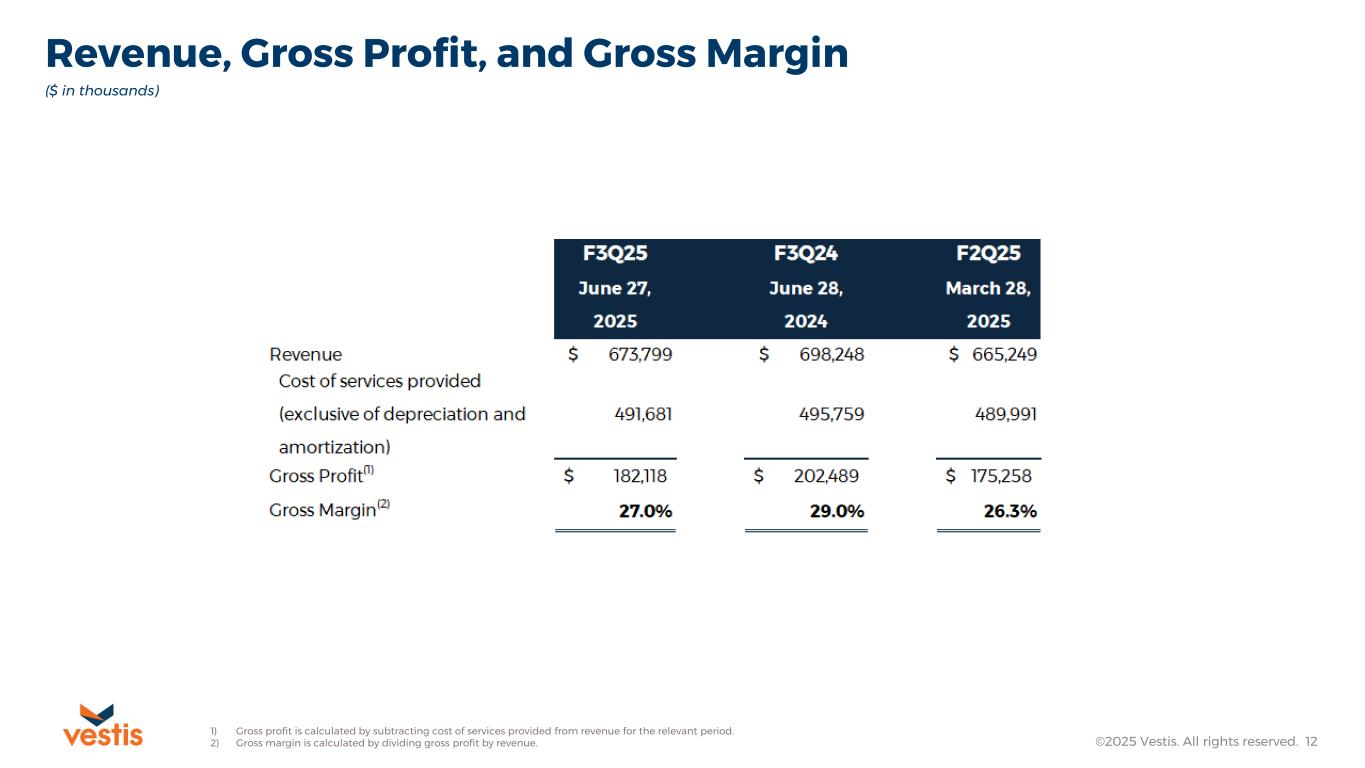
Revenue, Gross Profit, and Gross Margin ©2025 Vestis. All rights reserved. 12 ($ in thousands) 1) Gross profit is calculated by subtracting cost of services provided from revenue for the relevant period. 2) Gross margin is calculated by dividing gross profit by revenue.
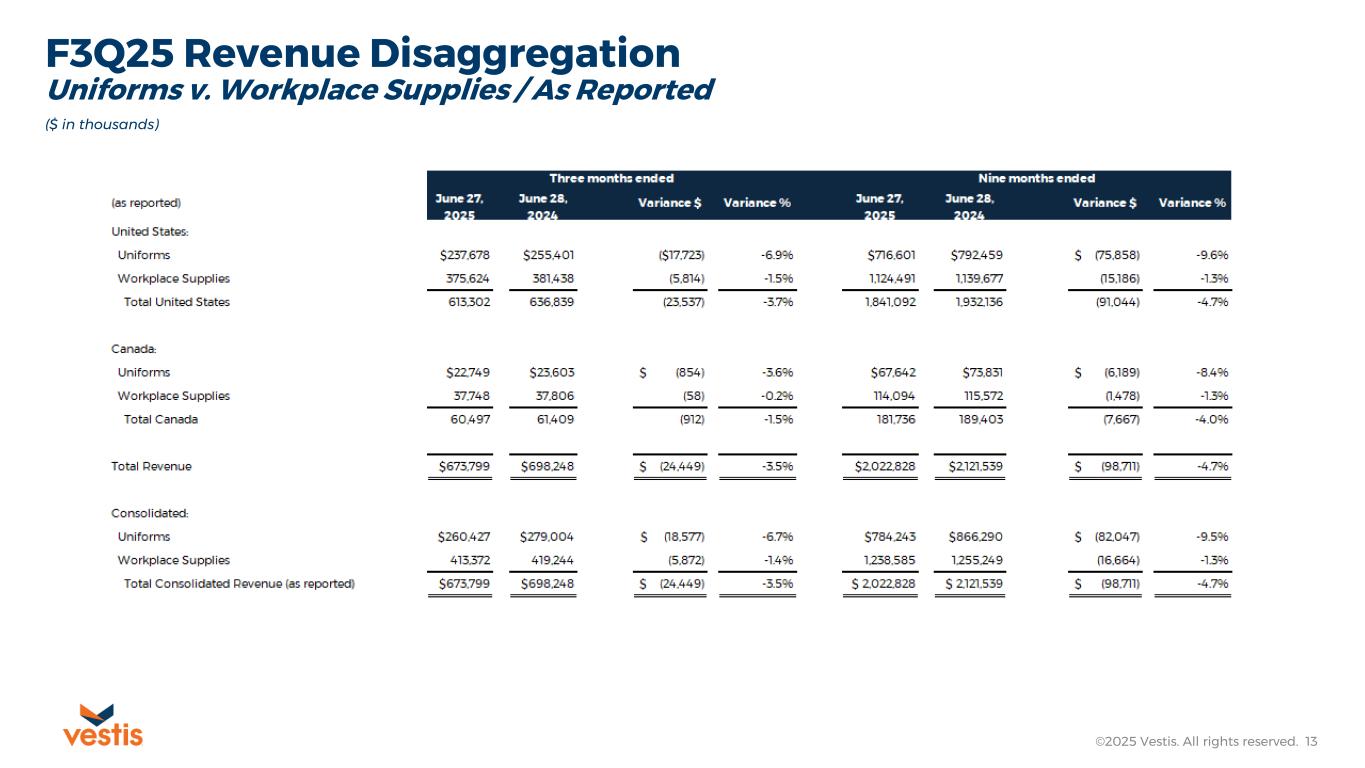
F3Q25 Revenue Disaggregation ©2025 Vestis. All rights reserved. 13 ($ in thousands) Uniforms v. Workplace Supplies / As Reported
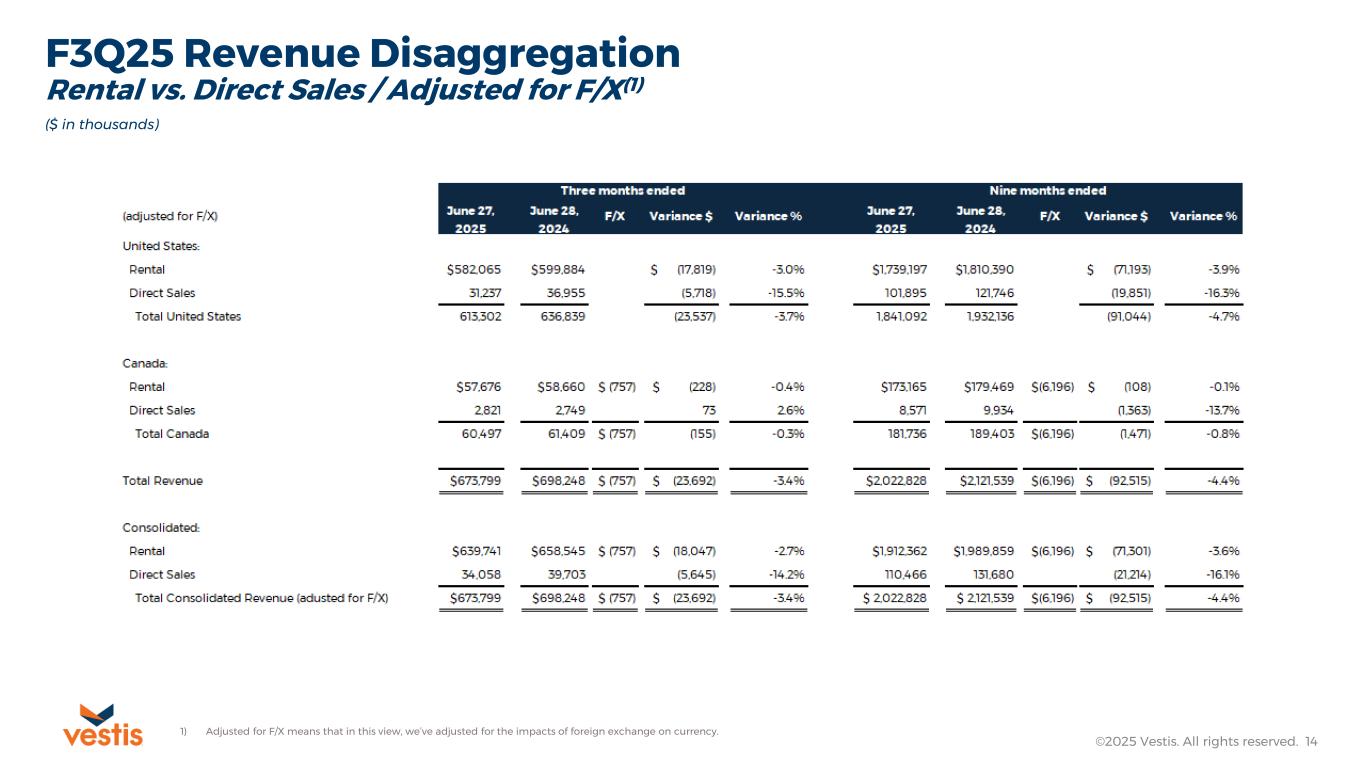
©2025 Vestis. All rights reserved. 14 F3Q25 Revenue Disaggregation ($ in thousands) Rental vs. Direct Sales / Adjusted for F/X(1) 1) Adjusted for F/X means that in this view, we’ve adjusted for the impacts of foreign exchange on currency.
Non-GAAP Definitions ©2025 Vestis. All rights reserved. 15 Vestis reports its financial results in accordance with U.S. GAAP, but in this presentation and the non-GAAP reconciliations that follow, Vestis also uses the following non-GAAP measures: Adjusted EBITDA, Adjusted EBITDA Margin, Free Cash Flow, Net Debt, Net Leverage Ratio, and Trailing Twelve Months Covenant Adjusted EBITDA. Vestis believes that non-GAAP financial measures, both together with and in addition to the corresponding U.S. GAAP financial measure, are important supplemental measures that exclude non-cash or other items that may not be indicative of or are unrelated to Vestis’ core operating results. Vestis uses these non-GAAP financial measures with U.S. GAAP financial measures and other comparable tools to assist in the evaluation of its operating performance. Vestis believes that presentation of these measures also helps investors because the measures enable better comparisons of Vestis’ historical results and allow investors to evaluate Vestis’ performance based on the same metrics that Vestis uses to evaluate its performance and trends in its results. However, these measures have limitations as analytical tools and should not be considered in isolation or as a substitute for Vestis’ results as reported under U.S. GAAP. Specifically, you should not consider these measures as alternatives to revenue, operating income, operating income margin, net income, net income margin or net cash provided by operating activities determined in accordance with U.S. GAAP. These non-GAAP financial measures also should not be considered as measures of cash available to Vestis to invest in the growth of Vestis’ business or cash that will be available to Vestis to meet its obligations. Non-GAAP financial measures as presented by Vestis may not be comparable to other similarly titled measures of other companies because not all companies use identical calculations. These non-GAAP measures are reconciled in the tables at the end of this presentation. Adjusted EBITDA Adjusted EBITDA represents net income adjusted for provision for income taxes; interest expense, net; and depreciation and amortization (EBITDA), further adjusted for share-based compensation expense; severance; separation related charges; securitization fees; loss (gain) on sale of equity investment; third party debt amendment fees; legal reserves and settlements; gains, losses, and other items impacting comparability. Adjusted EBITDA is presented in order to reflect Vestis’ results in a manner that allows a better understanding of operational activities separate from the financial impact of decisions made for the long-term benefit of Vestis and other items impacting comparability between periods. Similar adjustments have been recorded in Adjusted EBITDA for earlier periods and similar types of adjustments can reasonably be expected to be recorded in Adjusted EBITDA in future periods. Adjusted EBITDA Margin Adjusted EBITDA Margin represents Adjusted EBITDA as a percentage of Revenue Free Cash Flow Free Cash Flow represents net cash provided by operating activities adjusted for purchases of property and equipment and other. Free Cash Flow is presented because it relates the operating cash flow of Vestis to the capital that is spent to continue and improve business operations, and indicates the amount of cash generated or used after capital expenditures that can be used for, among other things, investment in the Vestis business, strengthening the balance sheet, and repayment of debt obligations. Free cash flow does not represent the residual cash flow available for discretionary expenditures since there may be other nondiscretionary expenditures that are not deducted from the measure. Net Leverage Ratio, Net Debt, Covenant Adjusted EBITDA, Covenant Adjusted EBITDA Margin and Trailing Twelve Months Covenant Adjusted EBITDA Net Leverage Ratio is defined in Vestis’ credit agreement and is calculated as consolidated total indebtedness in excess of unrestricted cash (referred to herein as “Net Debt”), divided by the Trailing Twelve Months Covenant Adjusted EBITDA. Net Debt represents total principal debt outstanding, letters of credit outstanding, and finance lease obligations, less cash and cash equivalents. Covenant Adjusted EBITDA represents Adjusted EBITDA, as further modified by certain items specifically permitted under the credit agreement to assess compliance with its financial covenants. Covenant Adjusted EBITDA Margin is Covenant Adjusted EBITDA as a percentage of Revenue. Trailing Twelve Months Covenant Adjusted EBITDA represents Covenant Adjusted EBITDA for the preceding four fiscal quarters. Vestis believes that Net Leverage Ratio and its components are useful to investors because they are indicators of Vestis’ ability to meet its future financial obligations and are measures that are frequently used by investors and creditors. Return on Working Capital Return on working capital is calculated by dividing trailing twelve months Adjusted EBITDA with operating working capital.
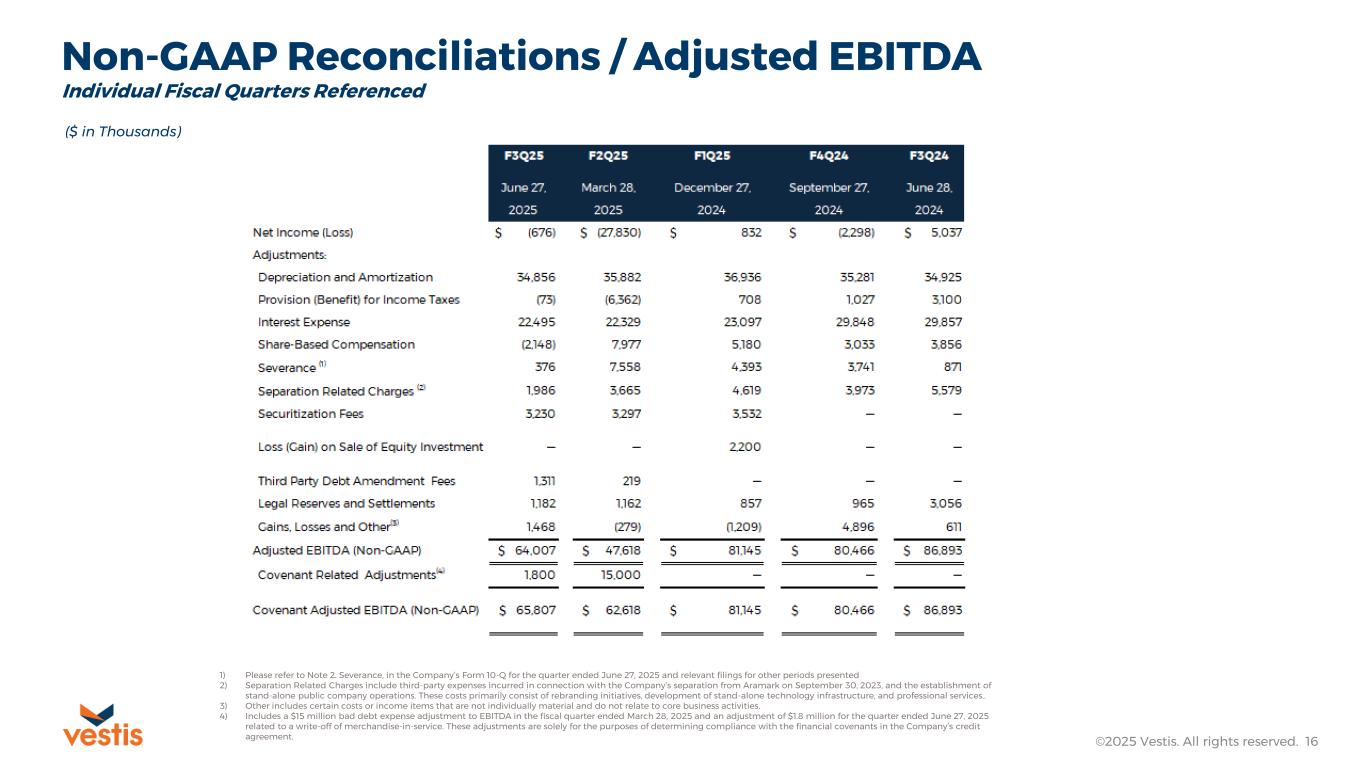
Non-GAAP Reconciliations / Adjusted EBITDA ©2025 Vestis. All rights reserved. 16 ($ in Thousands) 1) Please refer to Note 2. Severance, in the Company’s Form 10-Q for the quarter ended June 27, 2025 and relevant filings for other periods presented 2) Separation Related Charges include third-party expenses incurred in connection with the Company’s separation from Aramark on September 30, 2023, and the establishment of stand-alone public company operations. These costs primarily consist of rebranding initiatives, development of stand-alone technology infrastructure, and professional services.. 3) Other includes certain costs or income items that are not individually material and do not relate to core business activities. 4) Includes a $15 million bad debt expense adjustment to EBITDA in the fiscal quarter ended March 28, 2025 and an adjustment of $1.8 million for the quarter ended June 27, 2025 related to a write-off of merchandise-in-service. These adjustments are solely for the purposes of determining compliance with the financial covenants in the Company’s credit agreement. Individual Fiscal Quarters Referenced
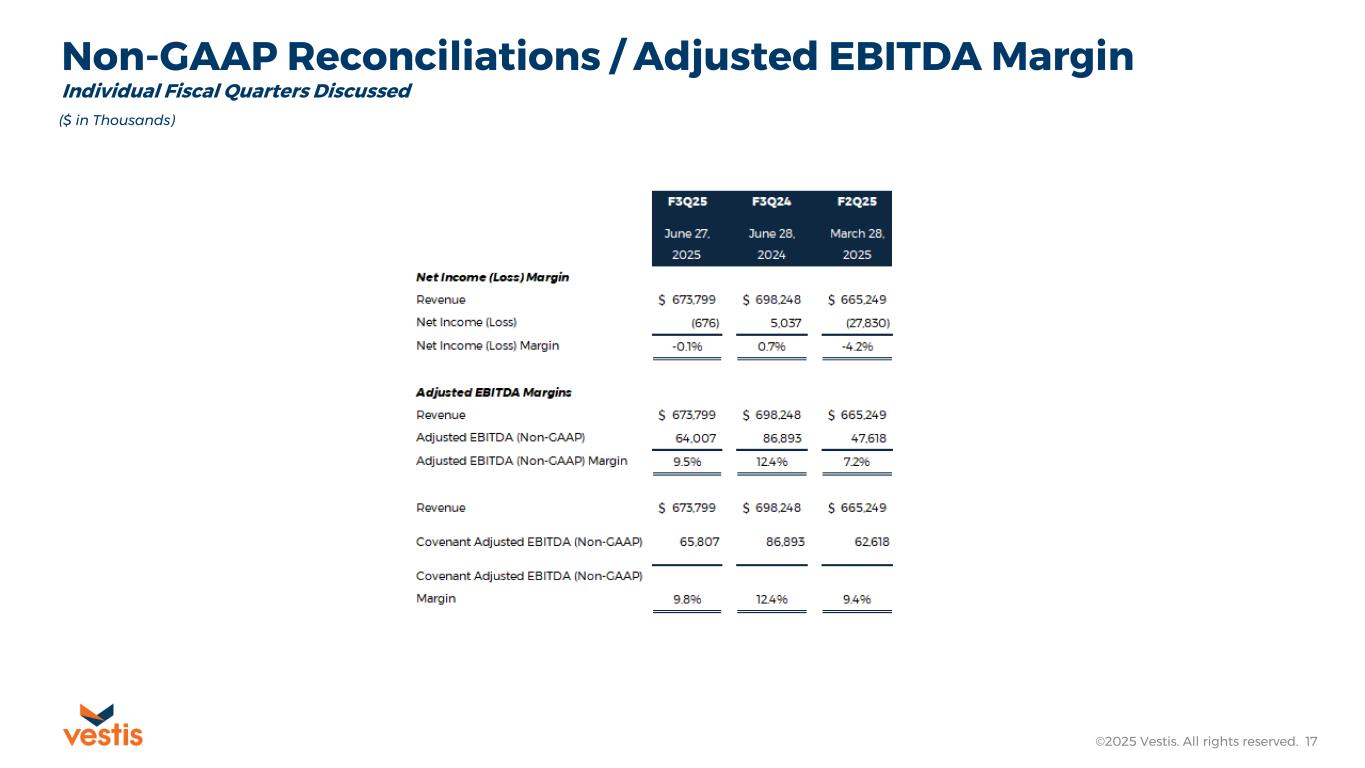
Non-GAAP Reconciliations / Adjusted EBITDA Margin ©2025 Vestis. All rights reserved. 17 ($ in Thousands) Individual Fiscal Quarters Discussed
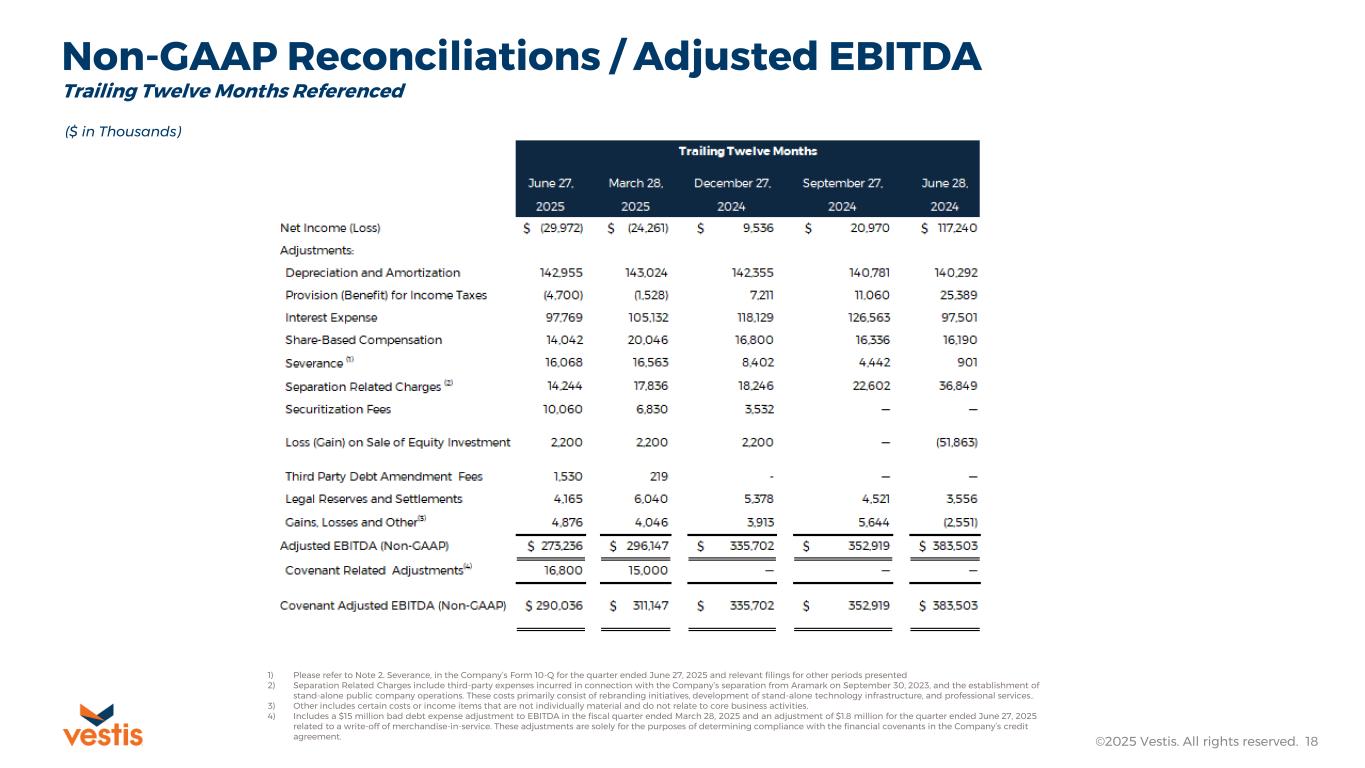
Non-GAAP Reconciliations / Adjusted EBITDA ©2025 Vestis. All rights reserved. 18 ($ in Thousands) 1) Please refer to Note 2. Severance, in the Company’s Form 10-Q for the quarter ended June 27, 2025 and relevant filings for other periods presented 2) Separation Related Charges include third-party expenses incurred in connection with the Company’s separation from Aramark on September 30, 2023, and the establishment of stand-alone public company operations. These costs primarily consist of rebranding initiatives, development of stand-alone technology infrastructure, and professional services.. 3) Other includes certain costs or income items that are not individually material and do not relate to core business activities. 4) Includes a $15 million bad debt expense adjustment to EBITDA in the fiscal quarter ended March 28, 2025 and an adjustment of $1.8 million for the quarter ended June 27, 2025 related to a write-off of merchandise-in-service. These adjustments are solely for the purposes of determining compliance with the financial covenants in the Company’s credit agreement. Trailing Twelve Months Referenced
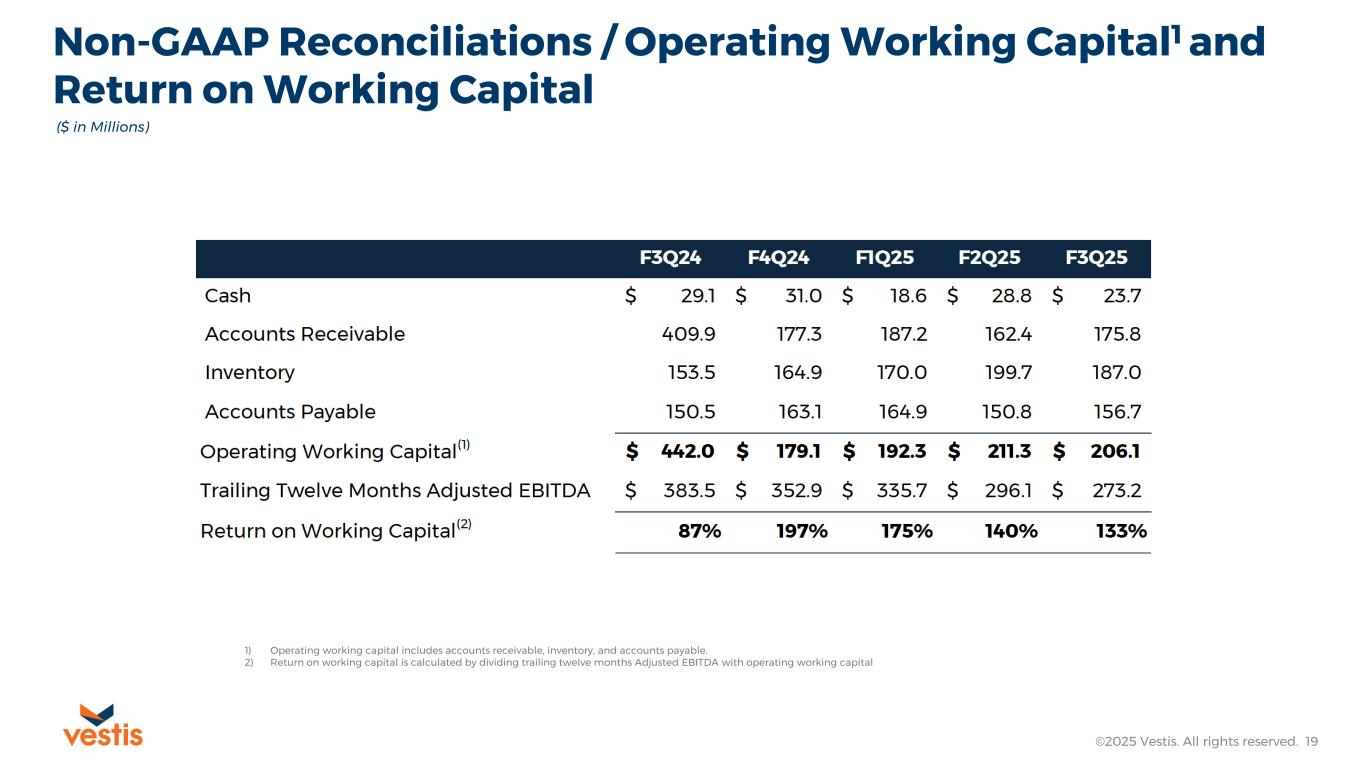
Non-GAAP Reconciliations / Operating Working Capital1 and Return on Working Capital ©2025 Vestis. All rights reserved. 19 ($ in Millions) 1) Operating working capital includes accounts receivable, inventory, and accounts payable. 2) Return on working capital is calculated by dividing trailing twelve months Adjusted EBITDA with operating working capital
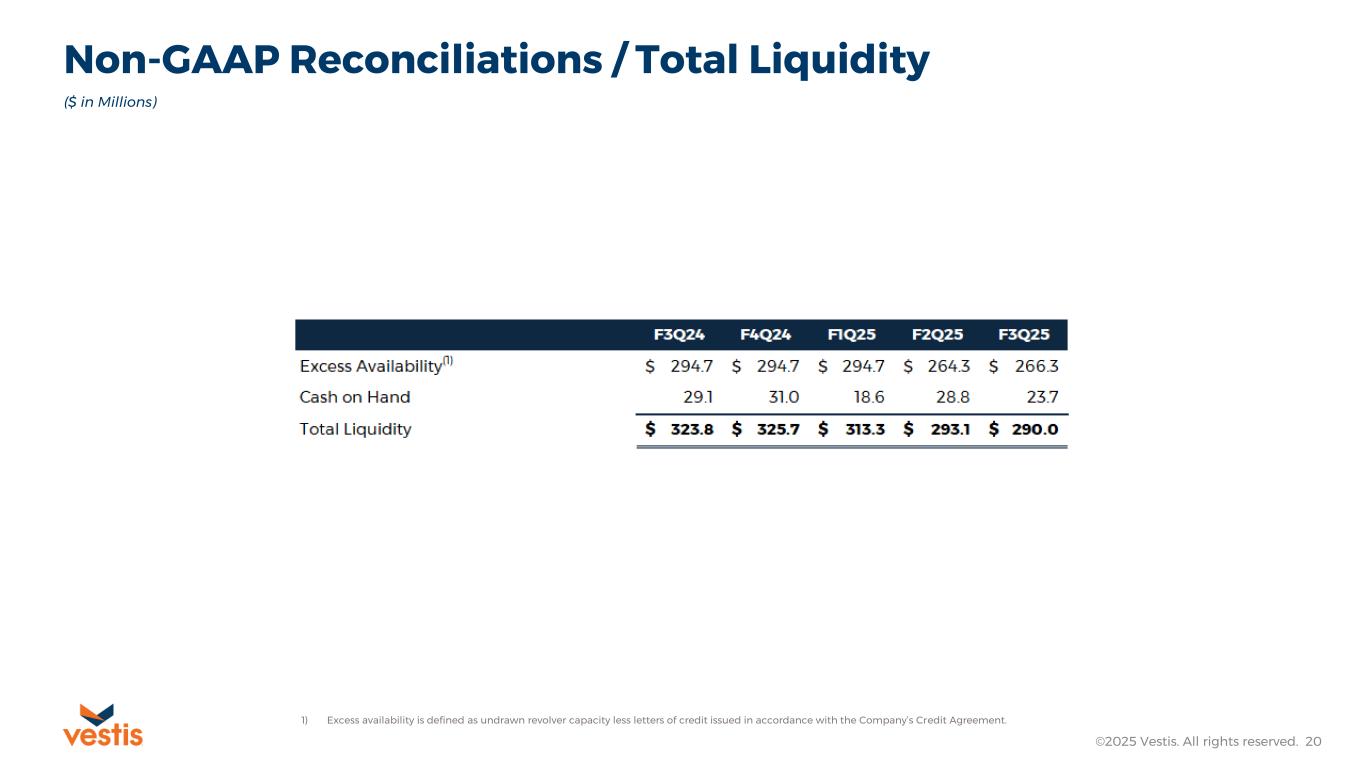
Non-GAAP Reconciliations / Total Liquidity ©2025 Vestis. All rights reserved. 20 ($ in Millions) 1) Excess availability is defined as undrawn revolver capacity less letters of credit issued in accordance with the Company’s Credit Agreement.
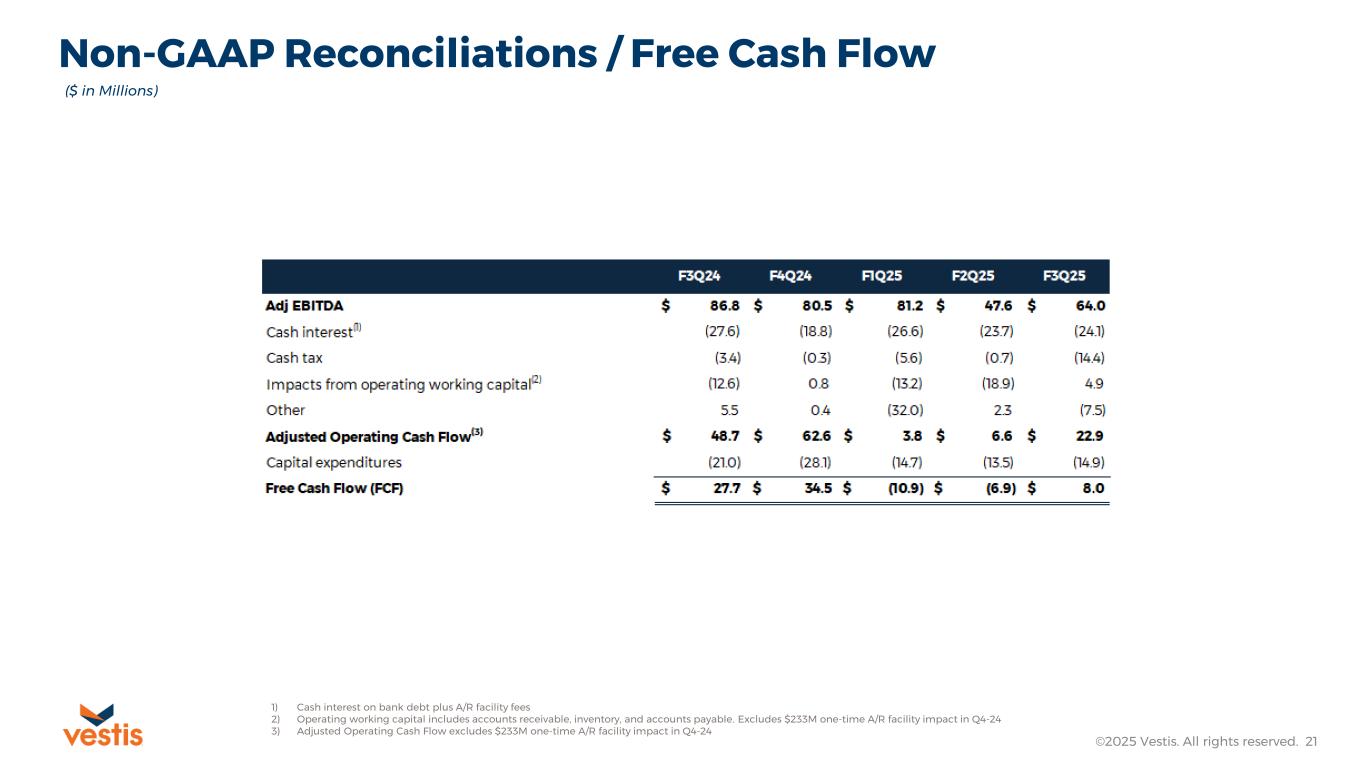
Non-GAAP Reconciliations / Free Cash Flow ©2025 Vestis. All rights reserved. 21 ($ in Millions) 1) Cash interest on bank debt plus A/R facility fees 2) Operating working capital includes accounts receivable, inventory, and accounts payable. Excludes $233M one-time A/R facility impact in Q4-24 3) Adjusted Operating Cash Flow excludes $233M one-time A/R facility impact in Q4-24
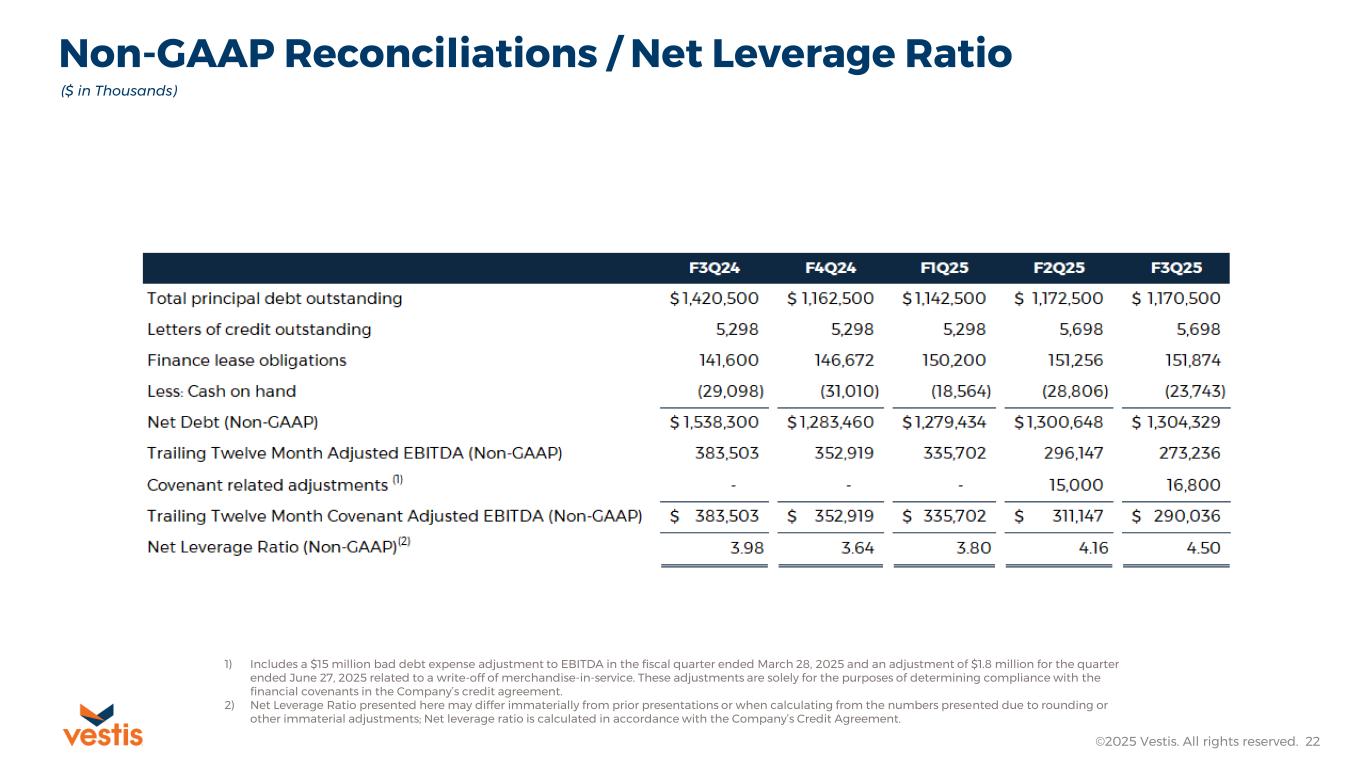
Non-GAAP Reconciliations / Net Leverage Ratio ©2025 Vestis. All rights reserved. 22 ($ in Thousands) 1) Includes a $15 million bad debt expense adjustment to EBITDA in the fiscal quarter ended March 28, 2025 and an adjustment of $1.8 million for the quarter ended June 27, 2025 related to a write-off of merchandise-in-service. These adjustments are solely for the purposes of determining compliance with the financial covenants in the Company’s credit agreement. 2) Net Leverage Ratio presented here may differ immaterially from prior presentations or when calculating from the numbers presented due to rounding or other immaterial adjustments; Net leverage ratio is calculated in accordance with the Company’s Credit Agreement.
©2025 Vestis. All rights reserved. 23